
Ottawa's Ethanol Credit Multiplier vs. the US 45Z Credit
By Kal Sharven
TL;DR: Ottawa is considering a credit multiplier under the Clean Fuel Regulations (CFR): domestic low-carbon fuel would earn more compliance credits per litre than the same imported fuel. ECCC’s December 2025 discussion paper says a multiplier of about 1.4 for biomass-based diesel and about 1.14 for ethanol would replicate the per-litre value US producers get from the 45Z tax credit. We rebuilt both numbers and re-ran them with 2026 45Z rules. For renewable diesel and biodiesel, ECCC’s 1.4 checks out: parity lands between about 1.37 and 1.46 at ECCC’s CAD 300 credit price. For ethanol, the answer depends on which Iowa plant is the benchmark. Working from published Iowa plant scores and removing the indirect land-use change (ILUC) emissions that 45Z no longer counts, an average Iowa plant scores about 51 kg CO2e/mmBtu, right at the 50 threshold, and earns roughly nothing from 45Z, so it needs no multiplier at all. ECCC’s 1.14 matches a plant scoring about 44 to 45, worth about US$0.11 a gallon. A plant that cuts its score to 30 (US$0.44) needs about 1.55, and one with carbon capture needs about 1.8. The multiplier is a single number applied to every Canadian plant, but the US benefit it is meant to offset ranges from zero to over 60 cents a gallon. Two things push the debate beyond the arithmetic. Carbon capture is arriving: Tallgrass’s Trailblazer pipeline has carried CO2 from Nebraska ethanol plants since October 2025, and every plant it connects moves US supply toward the top of the table. And because credits substitute for litres, a higher multiplier can trim demand for the underlying fuel wherever provincial mandates don’t already fix the volume.
How the Clean Fuel Regulations create value
A multiplier only makes sense once you see where CFR credits get their value, and that starts with the companies that have to buy them.
The obligation. The CFR obligates “fossil fuel primary suppliers,” which for liquid fuels means the companies that produce or import gasoline and diesel in Canada. Each must lower the carbon intensity (CI) of the fuel it supplies, reaching a cut of 10 g CO2e/MJ by 2030 from a 2016 baseline, roughly 11%. That is measured in credits, one credit per tonne of CO2e. At the end of each compliance period, a supplier has to retire credits equal to its obligation.
How a supplier meets it. There are three routes: create credits itself, buy them from someone else, or use the backstops in the regulation. Contributing to a registered emission-reduction funding program creates credits, and a supplier that has covered 10% of its requirement that way can defer part of the rest for up to five years, with the deferred amount growing 5% a year. A “credit clearance mechanism” also exists for suppliers that cannot find enough credits. Credits are created in three categories: reducing the emissions of producing fossil fuels (Category 1), supplying low-carbon fuels like ethanol, biodiesel, and renewable diesel (Category 2), and switching end-use fuel to natural gas, propane, or electricity (Category 3). Only Category 2 matters here.
Where an ethanol plant’s value comes from. A producer or importer of low-CI fuel who is registered under the CFR creates credits according to a formula: (reference CI minus the fuel’s CI) times the energy in the fuel, in tonnes. A litre of ethanol at 38 g/MJ, measured against ECCC’s 80.1 g/MJ reference (the 2030 value; the 2026 reference in the regulation is 85.3), earns about 0.00099 tonnes, or 986 credits per million litres. At CAD 300 a credit, that is about CAD 296,000 per million litres, or roughly 30 cents a litre. The producer does not collect that from the government. It collects it by selling the credits (or the fuel with the credits attached) to obligated suppliers, whose demand is set by the regulation. Credit prices then move with how tight the market is between obligation and supply. ECCC’s monthly market data show volume-weighted average prices of CAD 343 in the second quarter of 2026, CAD 328 in July, and CAD 301 in August, with individual trades as high as CAD 463 and two affiliate transfers reported at CAD 580. Quotes above CAD 400 reflect individual trades and spot quotes, not the market average.
Timing. Primary suppliers must use their credits against each compliance year by July 31 of the following year, and the market data cluster around that date. In July 2026, 5.7 million tonnes of credits were transferred, against an average of about 1.3 million a month in January to June. About 4.6 million tonnes of that had no reported price. ECCC’s notes say unpriced transfers are either “transfer on creation” agreements, where a producer’s credits go straight to the fuel buyer and the price sits inside the fuel invoice, or transfers at zero or near-zero price. ECCC does not explain the spike; the deadline and the footnotes together make that the most likely reading. Priced volume peaked in June (1.55 million tonnes at CAD 358) and prices eased after the deadline.
Why imports matter. The credit belongs to whoever creates it, wherever the fuel was made, so a US plant selling into Canada can earn the same credits as a Canadian plant. In 2024, more than 70% of CFR credits came from imported fuel, mostly from the US, and imported US grain ethanol supplied 61% of the ethanol used for compliance, according to the Renewable Fuels Association (RFA). That is the gap the multiplier targets: the US plant earns the CFR credits and the 45Z credit, and the Canadian plant earns only the CFR credits.
Who pays for a multiplier. A multiplier does not make any obligated supplier pay more per credit. Credits are interchangeable once created: a tonne is a tonne, whether it came from a multiplied Canadian litre or an imported one, so a supplier will not pay more than the going market price for any of them. What the multiplier changes is how many credits a domestic litre creates, not what each credit sells for. A Canadian producer with a 1.14 multiplier sells 14% more credits per litre into the same market at the same price. Because the obligation is fixed in tonnes, that extra supply has three effects. Some of those credits represent no additional emissions reduction, so the regulation delivers less carbon reduction than its headline target. The added supply pushes the market price down, which lowers the value of every credit, imported ones included, and widens the gap between imported and domestic fuel. And obligated suppliers as a group are roughly indifferent, or slightly better off if the price falls. In effect the cost is carried by the environmental target and by other credit holders, not by the buyers.
What Ottawa proposed
On September 5, 2025, the federal government announced targeted amendments to the CFR alongside a CAD 370 million Biofuel Production Incentive covering 2026 and 2027. ECCC’s discussion paper laid out two ways to favour domestic low-carbon fuel: a minimum domestic content requirement, or a credit multiplier. US trade groups have come out in favour of the multiplier over the domestic-content option.
The multiplier works on credit creation: a domestic low-carbon fuel would generate more credits per litre than the identical imported litre. ECCC left open that different fuels could get different multipliers, and it sized the two headline examples to “the per-litre value Canadian producers are giving up by not having an equivalent to 45Z.” Its stated inputs:
| Renewable diesel | Ethanol | |
|---|---|---|
| Multiplier | ~1.4 | ~1.14 |
| Credit price assumed (2030) | CAD 300/tonne | CAD 300/tonne |
| Reference carbon intensity | 80.1 g CO2e/MJ | 80.1 g CO2e/MJ |
| Average fuel carbon intensity | 30 g CO2e/MJ | 38 g CO2e/MJ |
| US production incentive | ~23 cents CAD/L | ~5 cents CAD/L |
The parity math
Setting the multiplier so a Canadian plant matches a US plant is a one-line calculation. A US plant selling into Canada earns 45Z plus the ordinary CFR credits (a multiplier of 1.0). A Canadian plant earns CFR credits times M and no 45Z. Parity requires:
M = 1 + (45Z value per litre, in CAD) / (CFR credit value per litre, in CAD)
Both pieces are computable from public rules:
- CFR credits per litre = (reference CI − fuel CI) × energy density × 10⁻⁶, multiplied by the credit price. The regulations (Schedule 2) set energy density at 23.419 MJ/L for ethanol, 34.921 MJ/L for renewable diesel, and 35.183 MJ/L for biodiesel.
- 45Z value per gallon = the applicable amount × (50 − emissions rate) / 50, where the rate is in kg CO2e/mmBtu. The statutory $1.00 (which requires prevailing-wage and apprenticeship compliance) is indexed to inflation. IRS Notice 2026-41 sets the 2026 factor at 1.0929, which makes the 2026 amount $1.09 a gallon (the no-wage-compliance base amount is 22 cents).
- Conversion: 3.785 litres per gallon and USD/CAD of 1.414 (the September 24 rate).
Back-testing ECCC. Plugging ECCC’s own inputs into this formula gives 1.17 for ethanol and 1.44 for renewable diesel, against its published 1.14 and 1.4. The diesel figure is close. The ethanol figure implies ECCC used a US benefit nearer 4 cents CAD/L than 5, well within the “approximately” in the paper. ECCC’s 5 cents converts to about US$0.13 a gallon, or a 45Z score of about 44 kg CO2e/mmBtu. The paper does not disclose the exchange rate or the exact 45Z score it used.
Ethanol: what Iowa plants actually score
The right starting question is what an Iowa dry-mill plant’s 45Z score really is. The best public data we could find is the Iowa Renewable Fuels Association’s Comparative Economics of Carbon Sequestration for Iowa Ethanol Plants, Phase 1 (February 2023). It reports published California-model (CA-GREET) scores for Iowa plants of 59 to 82 g CO2e/MJ, with a state average of 68.25 for each plant’s lowest published corn-starch score. Three adjustments matter before those numbers say anything about 45Z:
- Units. The study reports g CO2e/MJ. The 45Z credit uses kg CO2e/mmBtu. One mmBtu is 1,055 MJ, so multiply g/MJ by 1.055 to get kg/mmBtu.
- ILUC. Fuel made after 2025 must exclude indirect land-use change emissions (Notice 2026-53, September 8). DOE’s own 45ZCF-GREET user manual (September 2026 update, Table 10) puts the ILUC term for U.S. corn ethanol at 5.75 g CO2e/MJ, or about 6.1 kg CO2e/mmBtu. That is a single-digit change, not 20 to 25 points. (The model’s other indirect effects, “other crops” at −1.58 and livestock at +0.41 g/MJ, stay in the score.) For comparison, the GREET 3.0 default in the IRFA study carries 7.4 g/MJ, and the California model about 20 g/MJ; the “20 to 25” figure seen in some trade coverage matches the California-style number, not the model 45Z uses.
- Model and year. These are 2023 scores under California-model assumptions. The 45ZCF-GREET model (updated June 12 and September 8, 2026) differs in other inputs, plants have made efficiency gains since 2023, and 45Z now lets producers earn additional reductions from low-carbon farming practices.
Putting those together, an average Iowa plant lands at roughly 50 to 53 kg CO2e/mmBtu. The range depends on how the ILUC removal is handled: the study’s GREET-adjusted average of 55.83 g/MJ less 45ZCF-GREET’s 5.75 gives 52.8 kg/mmBtu, and swapping the study’s 7.4 g/MJ land-use term for the 45ZCF-GREET indirect effects that remain after 2025 (−1.17 g/MJ net) gives about 49.9. We use 51 as the central figure. The study’s national GREET default of 55.3 g/MJ gives about 50 by the same method. The best published Iowa score in the range (59 g/MJ on the California model) works out to about 40 to 41; the worst (82) works out to about 64 to 65, which earns nothing. The study’s own estimate that carbon capture cuts a plant’s score by about 30 points would bring a 51 plant to about 21. Because each point of score is worth about 2 cents a gallon ($1.09 ÷ 50), a 2 to 3 point uncertainty on the average plant is worth 4 to 7 cents, which is why the plant-average estimate should be read as “near the threshold,” not as a precise figure.
The table shows the multiplier that equalizes each score, for a Canadian plant at ECCC’s assumed CFR carbon intensity of 38 g/MJ, at four credit prices. CAD 300 is ECCC’s planning assumption and close to recent market averages. CAD 350 is about the second-quarter 2026 average. CAD 400 is near the spring peak in individual trades. CAD 200 is a stress case: prices have moved widely, and the multiplier is only as valuable as the credit it multiplies.
| 45Z score (kg CO2e/mmBtu) | Plant type | 45Z value (US$/gal) | 45Z value (CAD c/L) | M at CAD 200/t | M at CAD 300/t | M at CAD 350/t | M at CAD 400/t |
|---|---|---|---|---|---|---|---|
| 51 | Iowa average (IRFA, ILUC removed) | $0.00 | 0.0 | 1.00 | 1.00 | 1.00 | 1.00 |
| 48 | Modest improvement | $0.04 | 1.6 | 1.08 | 1.06 | 1.05 | 1.04 |
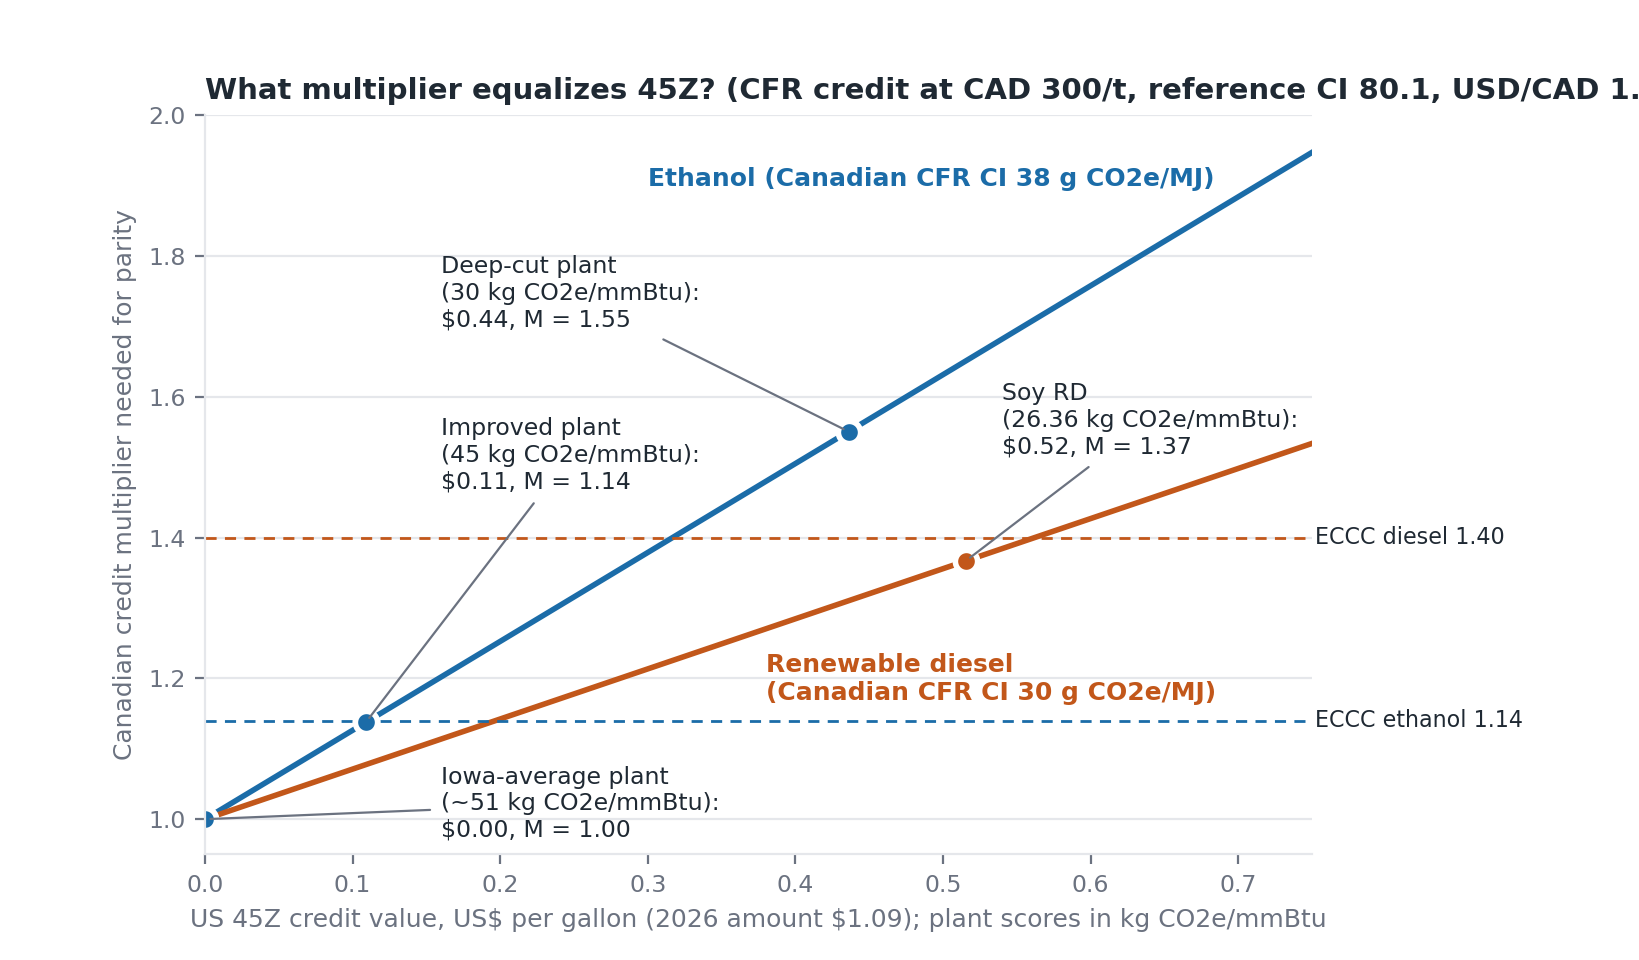
| 45 | Improved plant (≈ECCC’s implied 44) | $0.11 | 4.1 | 1.21 | 1.14 | 1.12 | 1.10 |
| 41 | Best published Iowa score | $0.20 | 7.3 | 1.37 | 1.25 | 1.21 | 1.19 |
| 35 | Large cuts | $0.33 | 12.2 | 1.62 | 1.41 | 1.35 | 1.31 |
| 30 | Deeper cuts | $0.44 | 16.3 | 1.83 | 1.55 | 1.47 | 1.41 |
| 21 | Carbon capture (IRFA ~30-point cut) | $0.63 | 23.6 | 2.20 | 1.80 | 1.68 | 1.60 |
Reading it across: at ECCC’s own credit price, its 1.14 is right for a plant that has taken a few points off the average, and too high for the average plant, which earns nothing from 45Z. It is too low for a plant that gets its score to the mid-30s or below. The multiplier is also much more sensitive to the credit price when the US benefit is large: for the score-30 plant it runs from 1.83 at CAD 200 to 1.41 at CAD 400.
One more input moves the answer: the Canadian plant’s own CFR score. A Canadian plant with a higher carbon intensity earns fewer credits per litre, so the multiplier has a smaller base to work on and must be larger to deliver the same cents. For the 45 plant at CAD 300, parity ranges from 1.12 (Canadian CI of 30) to 1.19 (CI of 50); for the score-30 plant it ranges from 1.46 to 1.77.
The last input is the reference carbon intensity. ECCC’s 80.1 g/MJ is the value that applies from 2030. In the regulation’s Schedule 1 the liquid-class reference is 85.3 in 2026, 84.0 in 2027, and 81.4 in 2029, the last year 45Z runs. A higher reference gives every litre more credits, so parity today is slightly lower than the 2030 tables show. At CAD 300, the improved plant (45) needs 1.12 in 2026 against 1.14 at 80.1, the score-30 plant needs 1.49 against 1.55, and the carbon-capture plant needs 1.71 against 1.80. For soy renewable diesel and biodiesel the 2026 figures are 1.33 and 1.42 against 1.37 and 1.46. By 2029 the gap narrows to a few hundredths. The effect is real but small, and it does not change any conclusion above.
Renewable diesel and biodiesel
The diesel side is where ECCC’s number holds. The soybean pathway gets the same ILUC exclusion, and there the change is larger: the DOE manual’s ILUC term is 13.57 g/MJ for soybean-oil renewable diesel (about 14.3 kg/mmBtu) and 11.9 g/MJ for biodiesel (about 12.6), against 5.75 for corn ethanol. The American Soybean Association, as reported by Grain Journal on August 28, puts soybean-oil renewable diesel at a score of 26.36 (down from 42.60) and soybean biodiesel at 20.23 (down from 33.70). Applying the 2026 formula at $1.09 gives $0.52 a gallon for renewable diesel and $0.65 for biodiesel. The ASA quotes slightly higher figures ($0.55 and $0.66); using those would raise the multipliers below by up to 0.02.
Parity for a Canadian plant at a CFR score of 30 g/MJ:
| Fuel | 45Z value (US$/gal) | 45Z value (CAD c/L) | M at CAD 200/t | M at CAD 300/t | M at CAD 350/t | M at CAD 400/t |
|---|---|---|---|---|---|---|
| Renewable diesel (soy, score 26.36) | $0.52 | 19.3 | 1.55 | 1.37 | 1.31 | 1.28 |
| Biodiesel (soy, score 20.23) | $0.65 | 24.2 | 1.69 | 1.46 | 1.39 | 1.34 |
At ECCC’s own credit price, its 1.4 sits between the two, so it is a fair round number for both fuels. At CAD 200 the multiplier needed climbs to 1.55 to 1.70, and at CAD 400 it falls to 1.28 to 1.34. If the reference feedstock is waste-based with a much lower score, the 45Z credit is larger and the multiplier needed is higher.
The chart shows the relationship directly. The ethanol line is steeper because ethanol earns fewer CFR credits per litre than diesel-range fuels at the same credit price, so each extra cent of 45Z requires more multiplier to offset.
The moving target: carbon capture
The rows in the middle of the ethanol table describe plants as they are today. The bottom row is where a growing share of US supply is heading. Tallgrass’s Trailblazer pipeline began carrying CO2 on October 3, 2025, from 11 ethanol plants in Nebraska and one in Iowa to storage in southeast Wyoming, and ADM and Tallgrass opened what they described as the world’s largest bioethanol carbon capture facility at Columbus, Nebraska. Trade coverage put the 45Z uplift for connected plants at as much as 65 cents a gallon, in line with the roughly $0.63 our formula gives for a score of 21. Southwest Iowa Renewable Energy has been reported as slated to connect in late 2026.
Other projects are further behind. Summit Carbon Solutions, which says it is working with 27 Iowa ethanol plants, has cut eight Iowa counties from its route and is still in permit review, with construction timing unclear. Wolf Carbon Solutions withdrew its Iowa permit application in December 2024. Capture-equipped plants also exist outside the pipeline story: Gevo acquired Red Trail Energy’s North Dakota ethanol plant and its capture assets in February 2025.
Under the parameters in our table, a plant at a score of 21 to 25 needs a multiplier of about 1.7 to 1.8 at CAD 300 and about 2.0 to 2.2 at CAD 200 for parity. Two further points cut in the same direction. First, the multiplier is a single number: if it is set for today’s typical competitor (1.14), capture plants keep a large advantage, and if it is set for them, it over-compensates the average plant. Second, our parity math gives the US and Canadian plants the same CFR credits per litre. If ECCC approves a lower CFR carbon intensity for a capture-equipped US plant, that plant also earns more CFR credits per litre, and the gap widens beyond the 45Z alone. We have not checked how ECCC treats capture in the pathways it approves for US exporters, so we leave that as an open upward risk.
What more credits per litre do to demand for the fuel itself
Credits are how the obligation gets met, and the obligation is fixed in tonnes. If a litre of domestic ethanol or renewable diesel creates 1.14 or 1.4 times as many credits, a supplier needs fewer litres of low-carbon fuel to cover the same tonnes. Taken alone, a multiplier is therefore a mild drag on demand for the underlying fuel, not a boost. It lowers the credit price, which weakens the incentive to blend beyond requirements, and it lets credits from multiplied litres substitute for credits from other fuels. How much that matters depends on whether a volume rule already fixes the litres.
- Where a mandate binds, the litres are set by law. Federal rules require 5% renewable content in gasoline, and provinces go further. Ontario’s gasoline requirement rises from 11% in 2025 to 13% in 2028 and 15% in 2030, and its domestic-content rules require 64% of that content to be made in Canada in 2026 and 2027, 54% in 2028 and 2029, and 47% from 2030, plus 75% for diesel. The gasoline shares work out to about 7% of Ontario gasoline volume in both 2026 and 2030. British Columbia requires 5% renewable content in gasoline and 8% in diesel, and since January 1, 2026 (gasoline) and April 1, 2025 (diesel) the eligible renewable fuel counted toward those minimums must be produced in Canada. That is a fully domestic requirement, not a share. In those markets, Canadian plants already have guaranteed volume, so the multiplier works more as a margin boost than a demand driver, and the volume floor stops the demand effect from running below the mandate.
- Where volume is discretionary, the effect bites. Blending above the floors, renewable diesel and biodiesel above the minimums, sustainable aviation fuel, and imports chosen on credit value all respond to the credit price. Ethanol and renewable diesel earn credits in the same category, so surplus credits from multiplied ethanol can displace demand for higher-cost renewable diesel credits. That makes the diesel side the more exposed segment.
- The obligation tightens over time. The liquid-class reference falls from 85.3 g/MJ in 2026 to 80.1 in 2030, which raises the credits suppliers need each year and gradually absorbs any slack the multiplier creates.
On balance, the multiplier is more likely to change who supplies the fuel, domestic or imported, than how much ethanol is used, and it can trim discretionary volumes and the credit price. We have not modelled the size of that effect. It is one more reason the parity numbers in this article describe a per-litre subsidy rather than a demand forecast.
So is 1.14 a reasonable number?
On the evidence here, yes as a starting point, with limits. Three things support it. ECCC used the right method: rebuilding it from the paper’s inputs gives 1.17, and at 2026 conditions the improved-plant case comes out at 1.12 to 1.14. It matches a plant a few points better than the Iowa average, which is a defensible picture of today’s marginal competitor. And it is not so large that it would flood the credit market.
Four things limit it. For the average Iowa plant, which earns roughly nothing from 45Z, 1.14 is more than parity requires. For the plants that are adding capture, it is well short: 1.7 to 1.8 at ECCC’s own credit price. It was set against 2030 parameters and a December 2025 view of 45Z, before the model update that removed ILUC from scoring. And it works on credits, so its dollar value moves with a credit price that has ranged widely, and it can dampen demand for the fuel where mandates don’t set the volume. A fair summary is that 1.14 is a reasonable central estimate for 2026 and 2027, not a parity guarantee, and the case for a higher number rests on the capture build-out, not on today’s average plant.
Caveats that cut both ways
- 45Z has an end date; the CFR does not, unless 45Z gets extended again. The US credit currently runs for fuel sold through 2029. A multiplier written into a permanent regulation would outlast the benefit it is meant to match, unless Congress extends 45Z again.
- A multiplier lowers the price it is multiplying. The parity tables hold the credit price fixed, which flatters the multiplier. Extra credits push the market price down, so a Canadian producer earns less per credit than the table assumes, and the multiplier needed for true parity is somewhat higher than shown. The size of the effect depends on how much of the credit supply is domestic low-carbon liquid fuel, which we could not quantify. It is likely small in a tight market and larger in one near clearing. ECCC lists credit-market impact among its factors for setting multipliers. The CAD 200 to CAD 400 columns show how much the price matters in the meantime.
- The 45Z is monetized at a discount. Most plants sell the credit rather than use it, and a sale price below face value shaves the US benefit and therefore the multiplier needed. We show face value throughout.
- This is per-litre parity, not a full competitiveness comparison. It ignores feedstock costs, freight, RIN and LCFS revenue, and the separate Biofuel Production Incentive, which would offset part of the gap for Canadian producers for two years.
- The Iowa scores are dated and model-dependent. The IRFA figures are from 2023 and use California-model assumptions. We removed ILUC and converted units, but a plant’s actual 2026 score depends on its own inputs and, increasingly, on farm-level practices through the USDA feedstock calculator. Treat 51 as an estimate of the average, not a certified figure.
What to watch
The number that matters is the one in the Canada Gazette, and draft regulatory text had not been published as of the latest reporting we found. Four things will decide whether a multiplier near 1.14 does what ECCC intends. The first is the distribution of US plant scores: if the average Iowa plant stays near the threshold, 1.14 already over-compensates for most US supply, while plants that pull ahead through carbon capture or farm practices keep an advantage the multiplier does not close, and each pipeline connection moves supply in that direction. The second is the credit price: at CAD 350 to CAD 400 a given multiplier does more work than at ECCC’s CAD 300 planning assumption, and at CAD 200 it does much less. Recent market averages have sat close to CAD 300. The third is demand: whether the volume floors in Ontario, British Columbia, and other provinces are enough to hold ethanol volumes steady while the multiplier trims discretionary demand. The fourth is whether ECCC sets different multipliers by fuel, as its paper allows, since diesel and ethanol come out differently.
The model behind these tables, including the ECCC back-test, the unit conversion of the IRFA plant scores, and the sensitivity runs, is saved in the site’s _research folder as 2026-09-28-cfr-multiplier-45z-equalization.py.