<?xml version="1.0" encoding="utf-8"?><feed xmlns="http://www.w3.org/2005/Atom" ><generator uri="https://jekyllrb.com/" version="3.10.0">Jekyll</generator><link href="https://smirnoccapital.github.io/smirnoc-capital/feed.xml" rel="self" type="application/atom+xml" /><link href="https://smirnoccapital.github.io/smirnoc-capital/" rel="alternate" type="text/html" /><updated>2026-09-29T02:04:19+00:00</updated><id>https://smirnoccapital.github.io/smirnoc-capital/feed.xml</id><title type="html">Smirnoc Capital</title><subtitle>Analysis of agricultural policy, trade, and market developments — and what they mean for farmers.</subtitle><entry><title type="html">Ottawa’s Ethanol Credit Multiplier vs. the US 45Z Credit</title><link href="https://smirnoccapital.github.io/smirnoc-capital/biofuels/trade-policy/energy-policy/2026/09/28/cfr-credit-multiplier-45z-parity.html" rel="alternate" type="text/html" title="Ottawa’s Ethanol Credit Multiplier vs. the US 45Z Credit" /><published>2026-09-28T00:00:00+00:00</published><updated>2026-09-28T00:00:00+00:00</updated><id>https://smirnoccapital.github.io/smirnoc-capital/biofuels/trade-policy/energy-policy/2026/09/28/cfr-credit-multiplier-45z-parity</id><content type="html" xml:base="https://smirnoccapital.github.io/smirnoc-capital/biofuels/trade-policy/energy-policy/2026/09/28/cfr-credit-multiplier-45z-parity.html"><![CDATA[<p><strong>By Kal Sharven</strong></p>

<p><strong>TL;DR:</strong> Ottawa is considering a credit multiplier under the Clean Fuel Regulations (CFR): domestic low-carbon fuel would earn more compliance credits per litre than the same imported fuel. ECCC’s December 2025 discussion paper says a multiplier of about <strong>1.4 for biomass-based diesel</strong> and about <strong>1.14 for ethanol</strong> would replicate the per-litre value US producers get from the 45Z tax credit. We rebuilt both numbers and re-ran them with 2026 45Z rules. For renewable diesel and biodiesel, ECCC’s 1.4 checks out: parity lands between about <strong>1.37 and 1.46</strong> at ECCC’s CAD 300 credit price. For ethanol, the answer depends on which Iowa plant is the benchmark. Working from published Iowa plant scores and removing the indirect land-use change (ILUC) emissions that 45Z no longer counts, an <strong>average Iowa plant scores about 51 kg CO2e/mmBtu, right at the 50 threshold, and earns roughly nothing</strong> from 45Z, so it needs no multiplier at all. ECCC’s 1.14 matches a plant scoring about 44 to 45, worth about US$0.11 a gallon. A plant that cuts its score to 30 (US$0.44) needs about <strong>1.55</strong>, and one with carbon capture needs about <strong>1.8</strong>. The multiplier is a single number applied to every Canadian plant, but the US benefit it is meant to offset ranges from zero to over 60 cents a gallon. Two things push the debate beyond the arithmetic. Carbon capture is arriving: Tallgrass’s Trailblazer pipeline has carried CO2 from Nebraska ethanol plants since October 2025, and every plant it connects moves US supply toward the top of the table. And because credits substitute for litres, a higher multiplier can trim demand for the underlying fuel wherever provincial mandates don’t already fix the volume.</p>

<h2 id="how-the-clean-fuel-regulations-create-value">How the Clean Fuel Regulations create value</h2>

<p>A multiplier only makes sense once you see where CFR credits get their value, and that starts with the companies that have to buy them.</p>

<p><strong>The obligation.</strong> The CFR obligates “fossil fuel primary suppliers,” which for liquid fuels means the companies that produce or import gasoline and diesel in Canada. Each must lower the carbon intensity (CI) of the fuel it supplies, reaching a cut of 10 g CO2e/MJ by 2030 from a 2016 baseline, roughly 11%. That is measured in credits, one credit per tonne of CO2e. At the end of each compliance period, a supplier has to retire credits equal to its obligation.</p>

<p><strong>How a supplier meets it.</strong> There are three routes: create credits itself, buy them from someone else, or use the backstops in the regulation. Contributing to a registered emission-reduction funding program creates credits, and a supplier that has covered 10% of its requirement that way can defer part of the rest for up to five years, with the deferred amount growing 5% a year. A “credit clearance mechanism” also exists for suppliers that cannot find enough credits. Credits are created in three categories: reducing the emissions of producing fossil fuels (Category 1), supplying low-carbon fuels like ethanol, biodiesel, and renewable diesel (Category 2), and switching end-use fuel to natural gas, propane, or electricity (Category 3). Only Category 2 matters here.</p>

<p><strong>Where an ethanol plant’s value comes from.</strong> A producer or importer of low-CI fuel who is registered under the CFR creates credits according to a formula: (reference CI minus the fuel’s CI) times the energy in the fuel, in tonnes. A litre of ethanol at 38 g/MJ, measured against ECCC’s 80.1 g/MJ reference (the 2030 value; the 2026 reference in the regulation is 85.3), earns about 0.00099 tonnes, or 986 credits per million litres. At CAD 300 a credit, that is about CAD 296,000 per million litres, or roughly 30 cents a litre. The producer does not collect that from the government. It collects it by selling the credits (or the fuel with the credits attached) to obligated suppliers, whose demand is set by the regulation. Credit prices then move with how tight the market is between obligation and supply. ECCC’s monthly market data show volume-weighted average prices of CAD 343 in the second quarter of 2026, CAD 328 in July, and CAD 301 in August, with individual trades as high as CAD 463 and two affiliate transfers reported at CAD 580. Quotes above CAD 400 reflect individual trades and spot quotes, not the market average.</p>

<p><strong>Timing.</strong> Primary suppliers must use their credits against each compliance year by July 31 of the following year, and the market data cluster around that date. In July 2026, 5.7 million tonnes of credits were transferred, against an average of about 1.3 million a month in January to June. About 4.6 million tonnes of that had no reported price. ECCC’s notes say unpriced transfers are either “transfer on creation” agreements, where a producer’s credits go straight to the fuel buyer and the price sits inside the fuel invoice, or transfers at zero or near-zero price. ECCC does not explain the spike; the deadline and the footnotes together make that the most likely reading. Priced volume peaked in June (1.55 million tonnes at CAD 358) and prices eased after the deadline.</p>

<p><strong>Why imports matter.</strong> The credit belongs to whoever creates it, wherever the fuel was made, so a US plant selling into Canada can earn the same credits as a Canadian plant. In 2024, more than 70% of CFR credits came from imported fuel, mostly from the US, and imported US grain ethanol supplied 61% of the ethanol used for compliance, according to the <a href="https://ethanolrfa.org/media-and-news/category/news-releases/article/2026/01/rfa-comments-on-proposed-amendments-to-canada-s-clean-fuel-regulations">Renewable Fuels Association</a> (RFA). That is the gap the multiplier targets: the US plant earns the CFR credits <strong>and</strong> the 45Z credit, and the Canadian plant earns only the CFR credits.</p>

<p><strong>Who pays for a multiplier.</strong> A multiplier does not make any obligated supplier pay more per credit. Credits are interchangeable once created: a tonne is a tonne, whether it came from a multiplied Canadian litre or an imported one, so a supplier will not pay more than the going market price for any of them. What the multiplier changes is how many credits a domestic litre creates, not what each credit sells for. A Canadian producer with a 1.14 multiplier sells 14% more credits per litre into the same market at the same price. Because the obligation is fixed in tonnes, that extra supply has three effects. Some of those credits represent no additional emissions reduction, so the regulation delivers less carbon reduction than its headline target. The added supply pushes the market price down, which lowers the value of every credit, imported ones included, and widens the gap between imported and domestic fuel. And obligated suppliers as a group are roughly indifferent, or slightly better off if the price falls. In effect the cost is carried by the environmental target and by other credit holders, not by the buyers.</p>

<h2 id="what-ottawa-proposed">What Ottawa proposed</h2>

<p>On September 5, 2025, the federal government announced targeted amendments to the CFR alongside a CAD 370 million Biofuel Production Incentive covering 2026 and 2027. ECCC’s <a href="https://www.canada.ca/en/environment-climate-change/corporate/transparency/consultations/share-view-ideas-targeted-amendments-clean-fuel-regulations/discussion-paper.html">discussion paper</a> laid out two ways to favour domestic low-carbon fuel: a minimum domestic content requirement, or a credit multiplier. US trade groups have come out in favour of the multiplier over the domestic-content option.</p>

<p>The multiplier works on credit creation: a domestic low-carbon fuel would generate more credits per litre than the identical imported litre. ECCC left open that different fuels could get different multipliers, and it sized the two headline examples to “the per-litre value Canadian producers are giving up by not having an equivalent to 45Z.” Its stated inputs:</p>

<table>
  <thead>
    <tr>
      <th> </th>
      <th>Renewable diesel</th>
      <th>Ethanol</th>
    </tr>
  </thead>
  <tbody>
    <tr>
      <td>Multiplier</td>
      <td>~1.4</td>
      <td>~1.14</td>
    </tr>
    <tr>
      <td>Credit price assumed (2030)</td>
      <td>CAD 300/tonne</td>
      <td>CAD 300/tonne</td>
    </tr>
    <tr>
      <td>Reference carbon intensity</td>
      <td>80.1 g CO2e/MJ</td>
      <td>80.1 g CO2e/MJ</td>
    </tr>
    <tr>
      <td>Average fuel carbon intensity</td>
      <td>30 g CO2e/MJ</td>
      <td>38 g CO2e/MJ</td>
    </tr>
    <tr>
      <td>US production incentive</td>
      <td>~23 cents CAD/L</td>
      <td>~5 cents CAD/L</td>
    </tr>
  </tbody>
</table>

<h2 id="the-parity-math">The parity math</h2>

<p>Setting the multiplier so a Canadian plant matches a US plant is a one-line calculation. A US plant selling into Canada earns 45Z <strong>plus</strong> the ordinary CFR credits (a multiplier of 1.0). A Canadian plant earns CFR credits times M and no 45Z. Parity requires:</p>

<p><strong>M = 1 + (45Z value per litre, in CAD) / (CFR credit value per litre, in CAD)</strong></p>

<p>Both pieces are computable from public rules:</p>

<ul>
  <li><strong>CFR credits per litre</strong> = (reference CI − fuel CI) × energy density × 10⁻⁶, multiplied by the credit price. The <a href="https://laws-lois.justice.gc.ca/eng/regulations/SOR-2022-140/page-12.html">regulations</a> (Schedule 2) set energy density at 23.419 MJ/L for ethanol, 34.921 MJ/L for renewable diesel, and 35.183 MJ/L for biodiesel.</li>
  <li><strong>45Z value per gallon</strong> = the applicable amount × (50 − emissions rate) / 50, where the rate is in kg CO2e/mmBtu. The statutory $1.00 (which requires prevailing-wage and apprenticeship compliance) is indexed to inflation. IRS <a href="https://www.irs.gov/pub/irs-irbs/irb26-29.pdf">Notice 2026-41</a> sets the 2026 factor at 1.0929, which makes the 2026 amount <strong>$1.09</strong> a gallon (the no-wage-compliance base amount is 22 cents).</li>
  <li><strong>Conversion</strong>: 3.785 litres per gallon and USD/CAD of 1.414 (the September 24 rate).</li>
</ul>

<p><strong>Back-testing ECCC.</strong> Plugging ECCC’s own inputs into this formula gives 1.17 for ethanol and 1.44 for renewable diesel, against its published 1.14 and 1.4. The diesel figure is close. The ethanol figure implies ECCC used a US benefit nearer 4 cents CAD/L than 5, well within the “approximately” in the paper. ECCC’s 5 cents converts to about US$0.13 a gallon, or a 45Z score of about 44 kg CO2e/mmBtu. The paper does not disclose the exchange rate or the exact 45Z score it used.</p>

<h2 id="ethanol-what-iowa-plants-actually-score">Ethanol: what Iowa plants actually score</h2>

<p>The right starting question is what an Iowa dry-mill plant’s 45Z score really is. The best public data we could find is the Iowa Renewable Fuels Association’s <em>Comparative Economics of Carbon Sequestration for Iowa Ethanol Plants, Phase 1</em> (February 2023). It reports published California-model (CA-GREET) scores for Iowa plants of <strong>59 to 82 g CO2e/MJ</strong>, with a state average of <strong>68.25</strong> for each plant’s lowest published corn-starch score. Three adjustments matter before those numbers say anything about 45Z:</p>

<ol>
  <li><strong>Units.</strong> The study reports g CO2e/MJ. The 45Z credit uses kg CO2e/mmBtu. One mmBtu is 1,055 MJ, so multiply g/MJ by <strong>1.055</strong> to get kg/mmBtu.</li>
  <li><strong>ILUC.</strong> Fuel made after 2025 must <a href="https://www.hklaw.com/en/insights/publications/2026/09/section-45z-2026-emissions-rate-table">exclude</a> indirect land-use change emissions (Notice 2026-53, September 8). DOE’s own 45ZCF-GREET user manual (September 2026 update, Table 10) puts the ILUC term for U.S. corn ethanol at <strong>5.75 g CO2e/MJ</strong>, or about <strong>6.1 kg CO2e/mmBtu</strong>. That is a single-digit change, not 20 to 25 points. (The model’s other indirect effects, “other crops” at −1.58 and livestock at +0.41 g/MJ, stay in the score.) For comparison, the GREET 3.0 default in the IRFA study carries 7.4 g/MJ, and the California model about 20 g/MJ; the “20 to 25” figure seen in some trade coverage matches the California-style number, not the model 45Z uses.</li>
  <li><strong>Model and year.</strong> These are 2023 scores under California-model assumptions. The 45ZCF-GREET model (updated June 12 and September 8, 2026) differs in other inputs, plants have made efficiency gains since 2023, and 45Z now lets producers earn additional reductions from low-carbon farming practices.</li>
</ol>

<p>Putting those together, an average Iowa plant lands at roughly <strong>50 to 53 kg CO2e/mmBtu</strong>. The range depends on how the ILUC removal is handled: the study’s GREET-adjusted average of 55.83 g/MJ less 45ZCF-GREET’s 5.75 gives 52.8 kg/mmBtu, and swapping the study’s 7.4 g/MJ land-use term for the 45ZCF-GREET indirect effects that remain after 2025 (−1.17 g/MJ net) gives about 49.9. We use <strong>51</strong> as the central figure. The study’s national GREET default of 55.3 g/MJ gives about 50 by the same method. The best published Iowa score in the range (59 g/MJ on the California model) works out to about 40 to 41; the worst (82) works out to about 64 to 65, which earns nothing. The study’s own estimate that carbon capture cuts a plant’s score by about 30 points would bring a 51 plant to about 21. Because each point of score is worth about 2 cents a gallon ($1.09 ÷ 50), a 2 to 3 point uncertainty on the average plant is worth 4 to 7 cents, which is why the plant-average estimate should be read as “near the threshold,” not as a precise figure.</p>

<p>The table shows the multiplier that equalizes each score, for a Canadian plant at ECCC’s assumed CFR carbon intensity of 38 g/MJ, at four credit prices. CAD 300 is ECCC’s planning assumption and close to recent market averages. CAD 350 is about the second-quarter 2026 average. CAD 400 is near the spring peak in individual trades. CAD 200 is a stress case: prices have moved widely, and the multiplier is only as valuable as the credit it multiplies.</p>

<table>
  <thead>
    <tr>
      <th>45Z score (kg CO2e/mmBtu)</th>
      <th>Plant type</th>
      <th>45Z value (US$/gal)</th>
      <th>45Z value (CAD c/L)</th>
      <th>M at CAD 200/t</th>
      <th>M at CAD 300/t</th>
      <th>M at CAD 350/t</th>
      <th>M at CAD 400/t</th>
    </tr>
  </thead>
  <tbody>
    <tr>
      <td>51</td>
      <td>Iowa average (IRFA, ILUC removed)</td>
      <td>$0.00</td>
      <td>0.0</td>
      <td>1.00</td>
      <td>1.00</td>
      <td>1.00</td>
      <td>1.00</td>
    </tr>
    <tr>
      <td>48</td>
      <td>Modest improvement</td>
      <td>$0.04</td>
      <td>1.6</td>
      <td>1.08</td>
      <td>1.06</td>
      <td>1.05</td>
      <td>1.04</td>
    </tr>
    <tr>
      <td><strong>45</strong></td>
      <td><strong>Improved plant (≈ECCC’s implied 44)</strong></td>
      <td><strong>$0.11</strong></td>
      <td><strong>4.1</strong></td>
      <td><strong>1.21</strong></td>
      <td><strong>1.14</strong></td>
      <td><strong>1.12</strong></td>
      <td><strong>1.10</strong></td>
    </tr>
    <tr>
      <td>41</td>
      <td>Best published Iowa score</td>
      <td>$0.20</td>
      <td>7.3</td>
      <td>1.37</td>
      <td>1.25</td>
      <td>1.21</td>
      <td>1.19</td>
    </tr>
    <tr>
      <td>35</td>
      <td>Large cuts</td>
      <td>$0.33</td>
      <td>12.2</td>
      <td>1.62</td>
      <td>1.41</td>
      <td>1.35</td>
      <td>1.31</td>
    </tr>
    <tr>
      <td>30</td>
      <td>Deeper cuts</td>
      <td>$0.44</td>
      <td>16.3</td>
      <td>1.83</td>
      <td>1.55</td>
      <td>1.47</td>
      <td>1.41</td>
    </tr>
    <tr>
      <td>21</td>
      <td>Carbon capture (IRFA ~30-point cut)</td>
      <td>$0.63</td>
      <td>23.6</td>
      <td>2.20</td>
      <td>1.80</td>
      <td>1.68</td>
      <td>1.60</td>
    </tr>
  </tbody>
</table>

<p>Reading it across: at ECCC’s own credit price, its 1.14 is right for a plant that has taken a few points off the average, and too high for the average plant, which earns nothing from 45Z. It is too low for a plant that gets its score to the mid-30s or below. The multiplier is also much more sensitive to the credit price when the US benefit is large: for the score-30 plant it runs from 1.83 at CAD 200 to 1.41 at CAD 400.</p>

<p>One more input moves the answer: the Canadian plant’s own CFR score. A Canadian plant with a higher carbon intensity earns fewer credits per litre, so the multiplier has a smaller base to work on and must be larger to deliver the same cents. For the 45 plant at CAD 300, parity ranges from 1.12 (Canadian CI of 30) to 1.19 (CI of 50); for the score-30 plant it ranges from 1.46 to 1.77.</p>

<p>The last input is the reference carbon intensity. ECCC’s 80.1 g/MJ is the value that applies from 2030. In the regulation’s Schedule 1 the liquid-class reference is <strong>85.3 in 2026</strong>, 84.0 in 2027, and 81.4 in 2029, the last year 45Z runs. A higher reference gives every litre more credits, so parity today is slightly lower than the 2030 tables show. At CAD 300, the improved plant (45) needs 1.12 in 2026 against 1.14 at 80.1, the score-30 plant needs 1.49 against 1.55, and the carbon-capture plant needs 1.71 against 1.80. For soy renewable diesel and biodiesel the 2026 figures are 1.33 and 1.42 against 1.37 and 1.46. By 2029 the gap narrows to a few hundredths. The effect is real but small, and it does not change any conclusion above.</p>

<h2 id="renewable-diesel-and-biodiesel">Renewable diesel and biodiesel</h2>

<p>The diesel side is where ECCC’s number holds. The soybean pathway gets the same ILUC exclusion, and there the change is larger: the DOE manual’s ILUC term is 13.57 g/MJ for soybean-oil renewable diesel (about 14.3 kg/mmBtu) and 11.9 g/MJ for biodiesel (about 12.6), against 5.75 for corn ethanol. The American Soybean Association, as <a href="https://www.grainjournal.com/article/1153414/updated-45z-model-could-boost-soybean-demand-and-farm-level-value">reported</a> by Grain Journal on August 28, puts soybean-oil renewable diesel at a score of 26.36 (down from 42.60) and soybean biodiesel at 20.23 (down from 33.70). Applying the 2026 formula at $1.09 gives <strong>$0.52</strong> a gallon for renewable diesel and <strong>$0.65</strong> for biodiesel. The ASA quotes slightly higher figures ($0.55 and $0.66); using those would raise the multipliers below by up to 0.02.</p>

<p>Parity for a Canadian plant at a CFR score of 30 g/MJ:</p>

<table>
  <thead>
    <tr>
      <th>Fuel</th>
      <th>45Z value (US$/gal)</th>
      <th>45Z value (CAD c/L)</th>
      <th>M at CAD 200/t</th>
      <th>M at CAD 300/t</th>
      <th>M at CAD 350/t</th>
      <th>M at CAD 400/t</th>
    </tr>
  </thead>
  <tbody>
    <tr>
      <td>Renewable diesel (soy, score 26.36)</td>
      <td>$0.52</td>
      <td>19.3</td>
      <td>1.55</td>
      <td>1.37</td>
      <td>1.31</td>
      <td>1.28</td>
    </tr>
    <tr>
      <td>Biodiesel (soy, score 20.23)</td>
      <td>$0.65</td>
      <td>24.2</td>
      <td>1.69</td>
      <td>1.46</td>
      <td>1.39</td>
      <td>1.34</td>
    </tr>
  </tbody>
</table>

<p>At ECCC’s own credit price, its 1.4 sits between the two, so it is a fair round number for both fuels. At CAD 200 the multiplier needed climbs to 1.55 to 1.70, and at CAD 400 it falls to 1.28 to 1.34. If the reference feedstock is waste-based with a much lower score, the 45Z credit is larger and the multiplier needed is higher.</p>

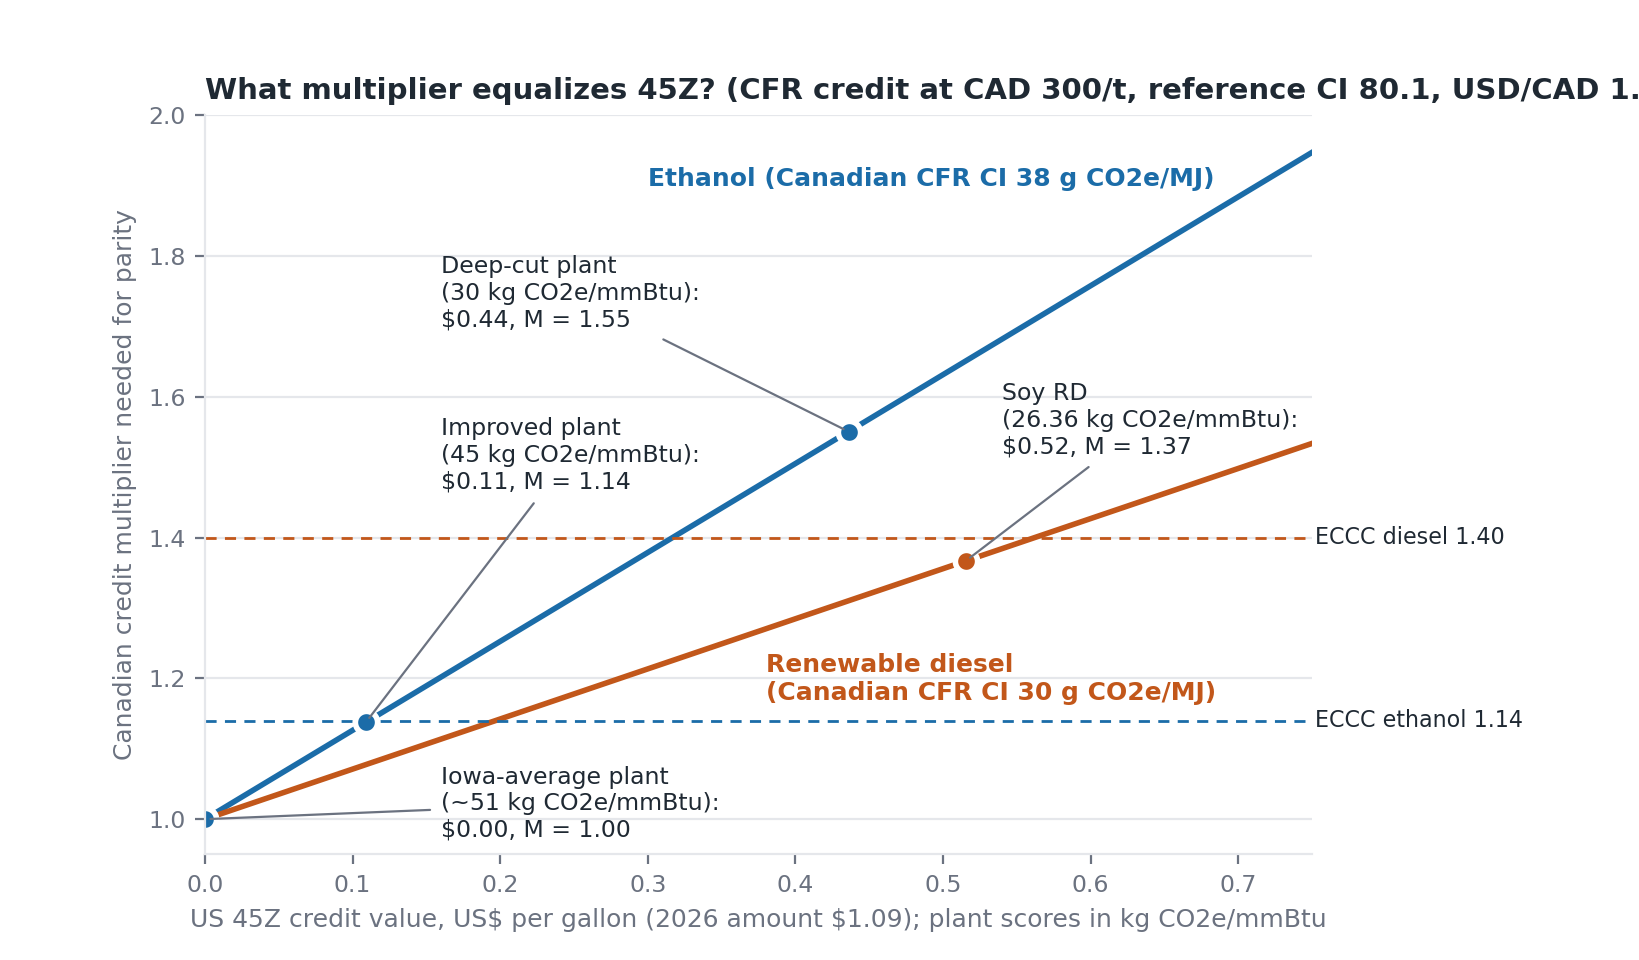
<p>The chart shows the relationship directly. The ethanol line is steeper because ethanol earns fewer CFR credits per litre than diesel-range fuels at the same credit price, so each extra cent of 45Z requires more multiplier to offset.</p>

<p><img src="/smirnoc-capital/assets/images/cfr-multiplier-45z-parity.png" alt="Multiplier needed for parity versus US 45Z credit value" /></p>

<h2 id="the-moving-target-carbon-capture">The moving target: carbon capture</h2>

<p>The rows in the middle of the ethanol table describe plants as they are today. The bottom row is where a growing share of US supply is heading. Tallgrass’s Trailblazer pipeline began carrying CO2 on October 3, 2025, from <a href="https://www.mprnews.org/story/2025/11/01/nebraska-carbon-capture-project-succeeds-offering-hope-for-pipeline-efforts">11 ethanol plants in Nebraska and one in Iowa</a> to storage in southeast Wyoming, and <a href="https://investors.adm.com/news/news-details/2025/ADM-Tallgrass-Celebrate-Opening-of-Worlds-Largest-Bioethanol-Carbon-Capture-Facility-in-Columbus-Nebraska/default.aspx">ADM and Tallgrass opened</a> what they described as the world’s largest bioethanol carbon capture facility at Columbus, Nebraska. Trade coverage put the 45Z uplift for connected plants at <a href="https://agupdate.com/farmandranchguide/news/technology/article_4ee1161a-31d7-4ea4-b338-b7339d5ef80a.html">as much as 65 cents a gallon</a>, in line with the roughly $0.63 our formula gives for a score of 21. Southwest Iowa Renewable Energy has been reported as slated to connect in late 2026.</p>

<p>Other projects are further behind. <a href="https://www.dtnpf.com/agriculture/web/ag/news/business-inputs/article/2026/07/02/summit-carbon-solutions-pipeline-new">Summit Carbon Solutions</a>, which says it is working with 27 Iowa ethanol plants, has cut eight Iowa counties from its route and is still in permit review, with construction timing unclear. <a href="https://carbonherald.com/wolf-carbon-solutions-abandons-carbon-pipeline-plans-in-iowa/">Wolf Carbon Solutions withdrew</a> its Iowa permit application in December 2024. Capture-equipped plants also exist outside the pipeline story: Gevo <a href="https://investors.gevo.com/news-releases/news-release-details/gevo-completes-acquisition-red-trail-energy-assets-north-dakota">acquired Red Trail Energy’s</a> North Dakota ethanol plant and its capture assets in February 2025.</p>

<p>Under the parameters in our table, a plant at a score of 21 to 25 needs a multiplier of about <strong>1.7 to 1.8 at CAD 300</strong> and about <strong>2.0 to 2.2 at CAD 200</strong> for parity. Two further points cut in the same direction. First, the multiplier is a single number: if it is set for today’s typical competitor (1.14), capture plants keep a large advantage, and if it is set for them, it over-compensates the average plant. Second, our parity math gives the US and Canadian plants the same CFR credits per litre. If ECCC approves a lower CFR carbon intensity for a capture-equipped US plant, that plant also earns more CFR credits per litre, and the gap widens beyond the 45Z alone. We have not checked how ECCC treats capture in the pathways it approves for US exporters, so we leave that as an open upward risk.</p>

<h2 id="what-more-credits-per-litre-do-to-demand-for-the-fuel-itself">What more credits per litre do to demand for the fuel itself</h2>

<p>Credits are how the obligation gets met, and the obligation is fixed in tonnes. If a litre of domestic ethanol or renewable diesel creates 1.14 or 1.4 times as many credits, a supplier needs fewer litres of low-carbon fuel to cover the same tonnes. Taken alone, a multiplier is therefore a mild drag on demand for the underlying fuel, not a boost. It lowers the credit price, which weakens the incentive to blend beyond requirements, and it lets credits from multiplied litres substitute for credits from other fuels. How much that matters depends on whether a volume rule already fixes the litres.</p>

<ul>
  <li><strong>Where a mandate binds, the litres are set by law.</strong> Federal rules require <a href="https://laws-lois.justice.gc.ca/eng/regulations/SOR-2022-140/page-12.html">5% renewable content in gasoline</a>, and provinces go further. Ontario’s gasoline requirement rises from 11% in 2025 to 13% in 2028 and 15% in 2030, and its <a href="https://ero.ontario.ca/notice/025-0669">domestic-content rules</a> require 64% of that content to be made in Canada in 2026 and 2027, 54% in 2028 and 2029, and 47% from 2030, plus 75% for diesel. The gasoline shares work out to about 7% of Ontario gasoline volume in both 2026 and 2030. British Columbia requires <a href="https://www2.gov.bc.ca/gov/content/industry/electricity-alternative-energy/transportation-energies/renewable-low-carbon-fuels/requirements">5% renewable content in gasoline and 8% in diesel</a>, and since January 1, 2026 (gasoline) and April 1, 2025 (diesel) the eligible renewable fuel counted toward those minimums must be produced in Canada. That is a fully domestic requirement, not a share. In those markets, Canadian plants already have guaranteed volume, so the multiplier works more as a margin boost than a demand driver, and the volume floor stops the demand effect from running below the mandate.</li>
  <li><strong>Where volume is discretionary, the effect bites.</strong> Blending above the floors, renewable diesel and biodiesel above the minimums, sustainable aviation fuel, and imports chosen on credit value all respond to the credit price. Ethanol and renewable diesel earn credits in the same category, so surplus credits from multiplied ethanol can displace demand for higher-cost renewable diesel credits. That makes the diesel side the more exposed segment.</li>
  <li><strong>The obligation tightens over time.</strong> The liquid-class reference falls from 85.3 g/MJ in 2026 to 80.1 in 2030, which raises the credits suppliers need each year and gradually absorbs any slack the multiplier creates.</li>
</ul>

<p>On balance, the multiplier is more likely to change <strong>who</strong> supplies the fuel, domestic or imported, than <strong>how much</strong> ethanol is used, and it can trim discretionary volumes and the credit price. We have not modelled the size of that effect. It is one more reason the parity numbers in this article describe a per-litre subsidy rather than a demand forecast.</p>

<h2 id="so-is-114-a-reasonable-number">So is 1.14 a reasonable number?</h2>

<p>On the evidence here, yes as a starting point, with limits. Three things support it. ECCC used the right method: rebuilding it from the paper’s inputs gives 1.17, and at 2026 conditions the improved-plant case comes out at 1.12 to 1.14. It matches a plant a few points better than the Iowa average, which is a defensible picture of today’s marginal competitor. And it is not so large that it would flood the credit market.</p>

<p>Four things limit it. For the average Iowa plant, which earns roughly nothing from 45Z, 1.14 is more than parity requires. For the plants that are adding capture, it is well short: 1.7 to 1.8 at ECCC’s own credit price. It was set against 2030 parameters and a December 2025 view of 45Z, before the model update that removed ILUC from scoring. And it works on credits, so its dollar value moves with a credit price that has ranged widely, and it can dampen demand for the fuel where mandates don’t set the volume. A fair summary is that 1.14 is a reasonable central estimate for 2026 and 2027, not a parity guarantee, and the case for a higher number rests on the capture build-out, not on today’s average plant.</p>

<h2 id="caveats-that-cut-both-ways">Caveats that cut both ways</h2>

<ul>
  <li><strong>45Z has an end date; the CFR does not, unless 45Z gets extended again.</strong> The US credit currently runs for fuel sold through 2029. A multiplier written into a permanent regulation would outlast the benefit it is meant to match, unless Congress extends 45Z again.</li>
  <li><strong>A multiplier lowers the price it is multiplying.</strong> The parity tables hold the credit price fixed, which flatters the multiplier. Extra credits push the market price down, so a Canadian producer earns less per credit than the table assumes, and the multiplier needed for true parity is somewhat higher than shown. The size of the effect depends on how much of the credit supply is domestic low-carbon liquid fuel, which we could not quantify. It is likely small in a tight market and larger in one near clearing. ECCC lists credit-market impact among its factors for setting multipliers. The CAD 200 to CAD 400 columns show how much the price matters in the meantime.</li>
  <li><strong>The 45Z is monetized at a discount.</strong> Most plants sell the credit rather than use it, and a sale price below face value shaves the US benefit and therefore the multiplier needed. We show face value throughout.</li>
  <li><strong>This is per-litre parity, not a full competitiveness comparison.</strong> It ignores feedstock costs, freight, RIN and LCFS revenue, and the separate Biofuel Production Incentive, which would offset part of the gap for Canadian producers for two years.</li>
  <li><strong>The Iowa scores are dated and model-dependent.</strong> The IRFA figures are from 2023 and use California-model assumptions. We removed ILUC and converted units, but a plant’s actual 2026 score depends on its own inputs and, increasingly, on farm-level practices through the USDA feedstock calculator. Treat 51 as an estimate of the average, not a certified figure.</li>
</ul>

<h2 id="what-to-watch">What to watch</h2>

<p>The number that matters is the one in the Canada Gazette, and draft regulatory text had not been published as of the latest reporting we found. Four things will decide whether a multiplier near 1.14 does what ECCC intends. The first is the distribution of US plant scores: if the average Iowa plant stays near the threshold, 1.14 already over-compensates for most US supply, while plants that pull ahead through carbon capture or farm practices keep an advantage the multiplier does not close, and each pipeline connection moves supply in that direction. The second is the credit price: at CAD 350 to CAD 400 a given multiplier does more work than at ECCC’s CAD 300 planning assumption, and at CAD 200 it does much less. Recent market averages have sat close to CAD 300. The third is demand: whether the volume floors in Ontario, British Columbia, and other provinces are enough to hold ethanol volumes steady while the multiplier trims discretionary demand. The fourth is whether ECCC sets different multipliers by fuel, as its paper allows, since diesel and ethanol come out differently.</p>

<p><em>The model behind these tables, including the ECCC back-test, the unit conversion of the IRFA plant scores, and the sensitivity runs, is saved in the site’s <code class="language-plaintext highlighter-rouge">_research</code> folder as <code class="language-plaintext highlighter-rouge">2026-09-28-cfr-multiplier-45z-equalization.py</code>.</em></p>]]></content><author><name></name></author><category term="biofuels" /><category term="trade-policy" /><category term="energy-policy" /><summary type="html"><![CDATA[Environment and Climate Change Canada says a credit multiplier of about 1.14 for ethanol and 1.4 for biomass-based diesel would replicate the US 45Z credit. We rebuilt both numbers. Diesel holds up. Ethanol depends almost entirely on which Iowa plant you compare against: an average plant scores right at the 45Z threshold and earns close to nothing, while a plant with deep cuts needs a multiplier above 1.5.]]></summary></entry><entry><title type="html">Washington Floated a Diesel Export Ban This Week. The Refining Math Shows Why It Would Backfire — and Where E15 Actually Helps</title><link href="https://smirnoccapital.github.io/smirnoc-capital/energy-policy/biofuels/refining/2026/09/24/diesel-export-ban-e15-refining-math.html" rel="alternate" type="text/html" title="Washington Floated a Diesel Export Ban This Week. The Refining Math Shows Why It Would Backfire — and Where E15 Actually Helps" /><published>2026-09-24T00:00:00+00:00</published><updated>2026-09-24T00:00:00+00:00</updated><id>https://smirnoccapital.github.io/smirnoc-capital/energy-policy/biofuels/refining/2026/09/24/diesel-export-ban-e15-refining-math</id><content type="html" xml:base="https://smirnoccapital.github.io/smirnoc-capital/energy-policy/biofuels/refining/2026/09/24/diesel-export-ban-e15-refining-math.html"><![CDATA[<p><strong>By Kal Sharven</strong></p>

<p><strong>TL;DR:</strong> Diesel hit a national average of $6.53/gallon this week, up from $3.69 a year ago, as the Iran war and the Russia-Ukraine conflict choked Middle Eastern and Russian refined-product supply. On Tuesday, President Trump and Treasury Secretary Scott Bessent floated banning US diesel exports to bring the price down. By Wednesday the White House had backed off, after Energy Secretary Chris Wright, the American Petroleum Institute, GasBuddy, and the Chamber of Commerce all made the same point: refineries can’t produce diesel in isolation. A barrel of crude becomes gasoline, diesel, and jet fuel together, in something close to fixed proportions, and US refiners are already running at 97.8% of capacity — there’s no slack to make more of everything. Cutting diesel exports doesn’t free up diesel for the domestic market; it just cuts total refinery runs, taking gasoline and jet fuel down with it. The Gulf Coast, which supplies over 90% of US distillate exports, is also structurally disconnected from the Midwest farm belt that’s supposedly being protected — Iowa’s diesel comes from regional refineries and pipelines fed by Oklahoma, Kansas, Minnesota, and Wisconsin, not the Gulf. A more coherent lever is raising the ethanol blend rate from E10 to E15, which doesn’t require more crude throughput at all — it just changes how much of the gasoline pool has to be refined from petroleum in the first place. That mechanism is real, and Washington is already leaning on it (EPA issued an emergency nationwide E15 waiver back in March, and a permanent year-round E15 bill is sitting in the Senate). But it has a ceiling nobody pushing it seems to mention: converting the <em>entire</em> US gasoline pool to E15 would require about 1.75 billion more gallons of ethanol a year than the country currently has the capacity to produce.</p>

<h2 id="the-week-this-happened">The week this happened</h2>

<p>Diesel prices have been climbing all year, but the acute spike is recent: from about $3.69/gallon a year ago to $6.5276/gallon this week, with roughly a dollar of that increase coming in the last month alone. The proximate cause is geopolitical, not domestic — the US-Iran war has disrupted shipping through the Strait of Hormuz and Bab el-Mandeb, and the Russia-Ukraine war continues to squeeze Russian refined-product exports, tightening the global diesel market that US barrels increasingly serve.</p>

<p>On Tuesday, September 22, Trump and Bessent signaled openness to restricting US diesel exports, with Bessent describing it as a feasibility review — “examining whether it’s feasible… whether a full or partial ban would work.” Politico reported, citing unnamed sources, that the administration was preparing a possible 90-day export ban. By Wednesday, the White House had denied pursuing a formal ban, and Wright reframed the goal instead as finding “the most efficient way to get more diesel into the United States of America, and continue maximum flows of gasoline and jet fuel” — implicitly conceding that a ban would threaten exactly the gasoline and jet fuel supply it wasn’t meant to touch. The Chamber of Commerce and Business Roundtable sent a joint letter opposing the idea; API called it something that “would only compound the problem.”</p>

<h2 id="why-a-refinery-cant-give-you-diesel-without-gasoline">Why a refinery can’t give you diesel without gasoline</h2>

<p>The core objection, made almost identically by Wright, GasBuddy’s Patrick De Haan, and Rapidan Energy’s Bob McNally, is a refining-technology fact rather than a policy opinion: distillation splits one barrel of crude into a slate of products at once. The American Fuel &amp; Petrochemical Manufacturers — the US refiners’ own trade association — puts it plainly: refiners can shift yield among gasoline, diesel, and jet fuel in response to market signals, but that shifting is bounded by refinery configuration, crude input grades, and “the high costs of modifying refinery infrastructure,” with real transformation costs and minimum lead times attached, and “most operators have already captured the easiest gains.” On the secondary conversion units that do most of that shifting, industry technical literature on hydrocrackers puts the typical usable conversion-rate adjustment at roughly 10-20% before other constraints — heater limits, fractionation capacity, catalyst behavior — bind. Refiners are, in fact, leaning on that flexibility right now: EIA data show jet fuel took a record share of US refinery output in 2024 as refiners shifted barrels toward it, evidence the slate does move — just not freely, and not on short notice.</p>

<p>The direction of that shift is visible in EIA’s own refinery yield data. The average US barrel yielded 47.8% finished motor gasoline in 2021; by 2025 that had fallen to 45.9%. Over the same years, the distillate yield rose from 29.7% to 30.0%, essentially flat but part of a longer upward drift. Refiners have already been quietly reallocating yield toward diesel as diesel cracks have widened — which is the strongest evidence the yield ratio isn’t rigid. It’s also evidence of how small the annual movement is: two percentage points of gasoline yield over four years, not a switch refiners can throw overnight.</p>

<p>What makes this bind acutely right now is capacity, not just proportions. US refinery utilization hit 97.8% in the first week of September — among the highest rates in years. At that level there’s essentially no idle crude-processing capacity to absorb a policy shock. If exports of one product are restricted and a refiner’s realized revenue on that barrel drops, the textbook response — confirmed by both Wright and De Haan this week — is to run less crude, not to somehow produce the same diesel and just keep it domestic. Less crude run means less of everything: less diesel, less gasoline, less jet fuel. An export ban aimed narrowly at diesel prices arrives instead as a broad-based fuel-supply shock.</p>

<h2 id="the-gulf-coast-doesnt-reach-iowa-the-way-youd-think">The Gulf Coast doesn’t reach Iowa the way you’d think</h2>

<p>This is the part of the story that gets lost in a Washington debate framed around “US refiners” as a single entity. Refining and export capacity for diesel are heavily concentrated on the Gulf Coast, and the Gulf Coast is not where Midwestern diesel comes from.</p>

<p>On EIA’s own numbers, the arithmetic is stark. Gulf Coast (PADD 3) refiners exported 1,127 thousand barrels per day of distillate fuel oil in 2025. Total US distillate exports that year averaged roughly 1,250 thousand barrels per day. That puts the Gulf Coast’s share of all US diesel exports at just over 90%. Diesel exports, in other words, are close to a single-region phenomenon.</p>

<p>The Midwest (PADD 2) — where Iowa sits — has spent the last decade building the opposite kind of independence. EIA analysis of the region found in-region refineries covering 84% of the Midwest’s own fuel needs by 2015, with regional refining capacity growing roughly 500,000 barrels per day (14%) against consumption growth of only about 200,000 barrels per day (4%) since 2010 — a gap that has kept widening since. As of June 2026, Midwest refineries were running at 100.6% of nameplate operable capacity, on 4.28 million barrels per day of capacity — a region running as hard as the Gulf Coast, on its own account, largely independent of it.</p>

<p>The pipeline geography backs this up directly. Iowa’s diesel moves mainly through the Magellan Pipeline system, which EIA analysis describes as fed “mostly by refineries in Oklahoma, Kansas, Minnesota, and Wisconsin” — not the Gulf Coast. Regional refineries like Flint Hills’ Pine Bend plant in Minnesota (392,000 barrels/day, supplying more than half of that state’s own gasoline and diesel) and Phillips 66’s Wood River refinery in Illinois (173,000 barrels/day, including 70,000 barrels/day of distillate) are the actual local supply base. The one pipeline that does run Gulf Coast crude oil products north — Explorer Pipeline, from Port Arthur, Texas to Hammond, Indiana — terminates near Chicago, at the eastern edge of the Midwest, and connects into the Magellan system at only a single point in Glenpool, Oklahoma, making it a minor, secondary contributor to Magellan’s own regional supply rather than its backbone.</p>

<p>Put together: even in the scenario the export-ban proponents imagine — a Gulf Coast diesel glut, as barrels that would have gone to Mexico or Europe pile up with nowhere to go — that surplus doesn’t have an efficient path into Iowa. It isn’t a matter of the “pipelines shutting down” in a literal sense; there’s no evidence of that specific mechanism in what’s been reported. But the region has neither the pipeline capacity nor, per the refiners’ own stated reaction to lost export revenue, the incentive to simply reroute that volume north. The documented response to a export-driven revenue hit is refiners cutting runs, not rerouting barrels a thousand miles inland through a pipeline network that wasn’t built for that flow. A ban aimed at helping Midwestern farmers and truckers would primarily disrupt a market — Gulf Coast exports — that Midwestern diesel prices were never structurally tied to in the first place.</p>

<h2 id="what-a-ban-would-put-at-risk-precisely">What a ban would put at risk, precisely</h2>

<p>It’s worth being specific about what “restricting exports” would actually restrict, because the exposed volumes are concrete. Mexico was the single largest destination for US distillate fuel oil in June 2026, taking 288,000 barrels per day out of 1,432,000 barrels per day in total US distillate exports that month — about a fifth of everything the US shipped. Mexico’s own diesel production has been rising sharply: national output climbed from roughly 162,000 to 280,700 barrels per day between November 2024 and November 2025, as Pemex’s national refining system crossed 1 million barrels per day of crude processing for the first time since 2015, and its long-delayed Olmeca refinery at Dos Bocas posted a record 252,000 barrels per day of fuel output in July 2026 — still only about 74% of its 340,000-barrel-per-day design capacity. Even with that ramp-up, Mexico’s own energy ministry (Sener) puts combined national gasoline-and-diesel demand at roughly 1.3 million barrels per day in 2026, leaving real, continuing room for imports to fill the gap. Europe is a smaller but real outlet: EIA’s destination data for June 2026 shows the Netherlands alone taking 143,000 barrels per day, with the UK, France, and Spain adding smaller volumes on top, as European buyers — themselves short of refining capacity and increasingly shut out of Russian and Middle Eastern barrels — have pulled US distillate east.</p>

<p>None of this is a case that US export customers deserve protection over US drivers. It’s a case that these are real, committed flows into markets that would either go unserved or bid the same tight global barrel away from someone else, and that abruptly withdrawing US supply doesn’t concentrate more diesel at the US pump — it mostly reshuffles who’s short.</p>

<h2 id="where-e15-actually-fits--and-where-it-runs-out-of-road">Where E15 actually fits — and where it runs out of road</h2>

<p>This is the more interesting policy lever, and it works through a completely different mechanism than an export ban. E15 doesn’t ask refiners to produce more diesel at all. It changes the composition of the gasoline pool that gets sold at the pump, so that a smaller share of each gallon has to be refined from petroleum in the first place — freeing refiners to lean their fixed, near-maximum crude runs further toward distillate without a resulting gasoline shortage. It attacks the actual constraint (a fixed barrel split at max utilization) instead of trying to legislate around it.</p>

<p>The numbers show both why this works and how far it can go. US finished motor gasoline demand has been running at roughly 370 million gallons per day in 2026 — about 135 billion gallons a year. At today’s roughly E10-equivalent blending, EPA’s 2026-2027 Renewable Fuel Standard projects about 14.4 billion gallons of ethanol consumption. A full national switch to E15 — 15% ethanol content across the entire pool — would require closer to 20.25 billion gallons a year, an increase of roughly 5.85 billion gallons over current use.</p>

<p>US ethanol production capacity, per the Renewable Fuels Association’s 2026 Industry Outlook, stands at 18.5 billion gallons a year across nearly 200 biorefineries. Actual 2025 production was a record 16.49 billion gallons — meaning the industry is already running about 2 billion gallons below its own nameplate ceiling. Even filling that entire gap wouldn’t be enough: 18.5 billion gallons of total capacity is itself about 1.75 billion gallons (roughly 9.5%) short of the 20.25 billion gallons a complete, immediate, nationwide E15 conversion would need. Some further complication: a meaningful share of US ethanol production is exported rather than blended domestically, so even reaching the 18.5-billion-gallon ceiling wouldn’t necessarily mean all of it becomes available for the US pool.</p>

<p>None of that makes E15 a bad idea — it makes it a real but bounded one. Every gallon of the roughly 2 billion gallons of spare capacity that gets blended in as E15 displaces a gallon of petroleum-based blendstock, which is exactly the kind of margin that eases the bind refiners are in at 97.8% utilization. It just isn’t a complete substitute for new refining or ethanol capacity, and the “just switch to E15” framing tends to skip past the fact that the ethanol industry itself would need to expand roughly 10% beyond its current record output to fully supply a nationwide switch.</p>

<p>This is also not a hypothetical lever — it’s already partially in motion. EPA issued a temporary nationwide E15 emergency waiver on March 25, 2026, explicitly citing fuel costs from the Iran war, running in 20-day increments through the summer driving season. A permanent, year-round E15 bill (H.R. 1346) passed the House in May 2026 on a bipartisan 218-203 vote and is currently before the Senate, folded into a broader Agriculture Act provision. The emergency waiver is a stopgap; a fully wired-in nationwide E15 market would take longer to build out — both in infrastructure (RVP-compliant storage and dispensing) and in ethanol supply — than a summer waiver, but it moves in the direction the refining math actually supports, unlike an export ban.</p>

<h2 id="what-to-watch">What to watch</h2>

<ul>
  <li>Whether the Senate acts on H.R. 1346 or the Agriculture Act’s E15 provision, and on what timeline</li>
  <li>Whether US ethanol producers announce new capacity additions in response to sustained E15 demand signals, closing some of the 1.75-billion-gallon gap</li>
  <li>Refinery utilization and yield data in the coming months — a further rise in distillate yield would show refiners actively leaning into the diesel/gasoline trade-off</li>
  <li>Whether the diesel export ban idea resurfaces if prices don’t come down on their own, and whether any revived version carves out Mexico given how exposed that relationship is</li>
</ul>

<hr />

<p><em>This is a fast-moving story — the export ban proposal, the price levels, and the E15 legislative timeline could all change. This article may be updated as more information develops.</em></p>

<p><em>This analysis is for informational purposes only and does not constitute investment advice. See our <a href="/smirnoc-capital/disclaimer/">disclaimer</a> for details.</em></p>]]></content><author><name></name></author><category term="energy-policy" /><category term="biofuels" /><category term="refining" /><summary type="html"><![CDATA[Diesel hit $6.53/gallon this week and the White House briefly floated banning exports to bring the price down. Refinery yield data explains why that idea died within 48 hours, why the Gulf Coast glut it would create wouldn't reach Iowa anyway, and why higher ethanol blending is a more coherent lever — bounded by a real ethanol-supply ceiling nobody making that case seems to mention.]]></summary></entry><entry><title type="html">Ottawa Says Farmers Now Face a Negative Tax Rate on New Equipment. Three Scenarios Show When That’s Actually True</title><link href="https://smirnoccapital.github.io/smirnoc-capital/tax-policy/farm-economics/capital-investment/2026/09/23/productivity-mega-deduction-farm-scenarios.html" rel="alternate" type="text/html" title="Ottawa Says Farmers Now Face a Negative Tax Rate on New Equipment. Three Scenarios Show When That’s Actually True" /><published>2026-09-23T00:00:00+00:00</published><updated>2026-09-23T00:00:00+00:00</updated><id>https://smirnoccapital.github.io/smirnoc-capital/tax-policy/farm-economics/capital-investment/2026/09/23/productivity-mega-deduction-farm-scenarios</id><content type="html" xml:base="https://smirnoccapital.github.io/smirnoc-capital/tax-policy/farm-economics/capital-investment/2026/09/23/productivity-mega-deduction-farm-scenarios.html"><![CDATA[<p><strong>By Kal Sharven</strong></p>

<p><strong>TL;DR:</strong> The federal government’s new Productivity Mega Deduction lets businesses — including farms — write off 100% of most new equipment in the year of purchase, starting September 15, 2026. Finance Canada says this drops agriculture’s marginal effective tax rate (METR) to -6.0%. That number describes a hypothetical marginal dollar of investment, fully absorbed against income in the same year. In practice, whether a farm actually sees a negative tax bill depends on purchase size relative to income, and on two things the press release doesn’t mention. First, incorporation status: the same deduction is worth roughly 2-4 times more, dollar for dollar, to a farm taxed at personal rates (up to 53.53% at the top bracket) than to one taxed at the small-business corporate rate (12.2%) — which also means the loss-carryback math below is far more powerful, or far more constrained, depending which side of that line a farm sits on. Second, and this affects a large share of Ontario’s farmers specifically: if farming isn’t your <em>chief source of income</em> — a common situation for multi-income farm households — the restricted farm loss (RFL) rule caps how much of a big equipment write-off you can actually use against your other income at $17,500 a year, no matter whether the deduction itself is the AII’s 30% or the Mega Deduction’s 100%. For that group, the headline 100%-vs-30% comparison can be almost entirely beside the point.</p>

<h2 id="background">Background</h2>

<p>On September 15, 2026, Finance Canada introduced the Productivity Mega Deduction: permanent, 100% immediate expensing for most depreciable business property, framed as making Canada the most tax-competitive G7 country for new investment. The department’s release pegs Canada’s overall METR at 6.4% (versus 16.9% in the US and a 19.0% OECD average) and highlights sector-specific negative METRs — agriculture/fishing at -6.0%, manufacturing/processing at -1.2%, transportation/storage at -2.3%.</p>

<p>That’s a big, attention-grabbing number for a sector that’s used to seeing itself as a rounding error in federal tax announcements. It’s also worth being precise about what it means before farm operations start planning around it, because the Mega Deduction didn’t arrive in a vacuum. Budget 2025 (tabled November 2025) had already reinstated the Accelerated Investment Incentive — the enhanced first-year CCA regime originally introduced in 2018 and then scheduled to phase out — for property acquired after 2024 and available for use before 2030, with a further phase-down through 2033. Under the AII, machinery and equipment in CCA Class 8 (the class that covers most general farm machinery, at a 20% base rate) gets three times the normal first-year deduction and has the half-year rule suspended — in practice, a 30% write-off in year one instead of the standard 10%. That’s the baseline every farm buying equipment in 2025 or 2026 has already been working with. The Mega Deduction raises that ceiling from 30% to 100% for eligible property acquired on or after September 15, 2026.</p>

<p>Two mechanical points matter for what follows. First, the CCA system is a declining-balance pool: whatever you don’t claim in year one doesn’t disappear, it carries forward in the class and keeps depreciating. Second, claiming CCA is always discretionary — a taxpayer can claim less than the maximum allowed in any given year. Both facts turn out to matter more than the headline expensing rate.</p>

<h2 id="where-the--60-number-actually-comes-from">Where the -6.0% number actually comes from</h2>

<p>Finance Canada’s METR is a standard cost-of-capital calculation (the Jorgenson/King-Fullerton framework): it models a hypothetical marginal dollar of new investment, assumes it earns just enough to cover the required return, and asks what tax wedge that investment faces given the CCA treatment available to it. Critically, the model assumes the resulting deduction is fully and immediately usable against income taxed at the full statutory rate in the same period. That’s a reasonable assumption for a large, continuously profitable manufacturer replacing capital every year. It’s a much stronger assumption for a mid-size grain or livestock operation that might buy a single major piece of equipment once every eight or ten years, against a year’s income that may or may not be large enough to absorb the whole deduction at once.</p>

<p>The scenarios below use an illustrative Ontario farm, with Class 8 machinery at a 20% CCA rate throughout. The first pass assumes the farm is incorporated, taxed at the small business rate (12.2% — 9% federal + 3.2% Ontario) on active business income up to $500,000 and the general rate (26.5%) above that. Further down, the same three farms are run again as unincorporated sole proprietorships taxed at personal rates, because the answer changes substantially depending on which of those two a given operation actually is. These are simplified, illustrative numbers, not a survey of actual farm finances — the point is to isolate how purchase size, income, and business structure change the realized benefit, holding everything else constant.</p>

<h2 id="three-incorporated-farms-one-purchase-three-outcomes">Three incorporated farms, one purchase, three outcomes</h2>

<table>
  <thead>
    <tr>
      <th>Farm</th>
      <th>Pre-CCA income</th>
      <th>Equipment bought</th>
      <th>Old CCA (half-year)</th>
      <th>AII (Budget 2025)</th>
      <th>Mega Deduction</th>
    </tr>
  </thead>
  <tbody>
    <tr>
      <td>A — steady replacer</td>
      <td>$180,000/yr</td>
      <td>$60,000/yr, every year</td>
      <td>Tax: $21,228 (11.8%)</td>
      <td>Tax: $19,764 (11.0%)</td>
      <td>Tax: $14,640 (8.1%)</td>
    </tr>
    <tr>
      <td>B — lumpy, mid-size</td>
      <td>$180,000</td>
      <td>$480,000 combine, one year</td>
      <td>Tax: $16,104 (8.9%)</td>
      <td>Tax: $4,392 (2.4%)</td>
      <td>Tax: $0 — but creates a <strong>$300,000 non-capital loss</strong></td>
    </tr>
    <tr>
      <td>C — lumpy, larger operation</td>
      <td>$650,000</td>
      <td>$480,000 combine, one year</td>
      <td>Tax: $88,030 (13.5%)</td>
      <td>Tax: $62,590 (9.6%)</td>
      <td>Tax: $20,740 (3.2%)</td>
    </tr>
  </tbody>
</table>

<p><em>(Figures show first-year tax payable and tax as a share of pre-CCA income under each regime.)</em></p>

<p>The pattern: for Farm C, the Mega Deduction does exactly what the press release implies — the $480,000 write-off lands entirely within a single year’s income, and the average tax rate on that income falls hard, from 13.5% to 3.2%. For Farm A, the benefit is real but modest — a genuine acceleration of deductions the farm would have received anyway, just spread over many years instead of one. Farm B is the interesting case: the sticker deduction is $480,000, but only $180,000 of taxable income exists to absorb it. The other $300,000 becomes a non-capital loss, and what that loss is actually worth depends on what the farm does with it next.</p>

<h2 id="farm-a-a-real-but-modest-timing-driven-gain">Farm A: a real but modest, timing-driven gain</h2>

<p>Farm A replaces roughly $60,000 of equipment every year — well within its income, in every regime. Running this out eight years shows what “immediate” is actually worth for a farm that never has an income-absorption problem to begin with.</p>

<p>Under AII, each vintage of equipment ramps up over many years (30% in year one, 20% of the declining balance after that), so the <em>stock</em> of annual CCA claims across all vintages only approaches Farm A’s full $60,000 run-rate asymptotically — after 8 years it’s still climbing (about $51,000/year by year 8, versus a $60,000 flat run-rate that starts immediately under the Mega Deduction). At a 6% discount rate, the present value of the tax shield over that 8-year window is about $29,500 under AII versus $48,200 under the Mega Deduction — a difference of roughly $18,700. That’s a genuine, quantifiable benefit. It’s also purely a timing effect: Farm A was always going to deduct 100 cents on the dollar for every dollar it spends. The Mega Deduction just moves those deductions earlier, which is worth money (interest saved, or earned, on cash kept a year or two longer) but isn’t a change in how much tax the farm ultimately pays on its equipment spending over its life.</p>

<h2 id="farm-b-where-the-headline-claim-gets-complicated">Farm B: where the headline claim gets complicated</h2>

<p>Farm B is the case that motivated this piece: a farm whose equipment purchases come in large, infrequent lumps relative to its income — a new combine every eight to ten years being the textbook example in Ontario grain operations. Here the Mega Deduction’s 100% ceiling exceeds what the farm has income to use, and what happens to the excess depends on an election most farms won’t make unless they’re specifically advised to.</p>

<p>Three strategies, compared on the present value of tax paid over the 8-year cycle following the purchase:</p>

<table>
  <thead>
    <tr>
      <th>Strategy</th>
      <th>8-year NPV of tax paid (6% discount)</th>
    </tr>
  </thead>
  <tbody>
    <tr>
      <td>AII only (30% year-one ceiling, rest on declining balance)</td>
      <td>$99,847</td>
    </tr>
    <tr>
      <td>Mega Deduction, loss simply carried forward</td>
      <td>$88,843</td>
    </tr>
    <tr>
      <td>Mega Deduction, $300,000 loss partly carried back 3 years</td>
      <td>$30,116</td>
    </tr>
  </tbody>
</table>

<p>If Farm B just claims the full Mega Deduction and lets the resulting $300,000 non-capital loss sit in its default carryforward — which is what happens if nobody actively elects otherwise — it saves about $11,000 in present value versus sticking with AII. That’s real, but it’s a fraction of what the 100%-vs-30% headline suggests. To get close to the full theoretical benefit, the farm needs to file a loss carryback, refunding tax paid in the three prior years. Assuming three years of similar $180,000 income and roughly $22,000/year of tax paid in each, that carryback recovers about $65,880 in cash immediately — which is what drives the NPV down to $30,116, a genuine ~$70,000 present-value improvement over AII, and the scenario that would actually produce something like a negative effective tax rate in the purchase year (roughly -37% of that year’s income, once the refund is counted).</p>

<p>Two things limit how often that best case shows up in practice. First, the carryback is capped by tax actually paid in the prior three years — a young, recently-expanded, or recently-unprofitable operation won’t have $66,000 of prior tax to reclaim, whatever the size of this year’s purchase. Second, it’s an active election on the tax return, not something that happens automatically; a farm (or accountant) that doesn’t specifically plan for it defaults to the merely-decent carryforward outcome, not the dramatic one.</p>

<h2 id="farm-c-the-case-the-policy-actually-fits">Farm C: the case the policy actually fits</h2>

<p>Farm C has enough income that the entire $480,000 combine purchase clears in the same year without ever creating a loss — taxable income falls from $650,000 to $170,000, with no carryback election, no carryforward mechanics, nothing left on the table. Because a chunk of that income sits above the $500,000 small-business threshold and would otherwise be taxed at 26.5%, the same dollar of deduction is worth more to Farm C than to Farm A or B. This is closest to the assumption baked into Finance Canada’s METR model — a marginal investment, fully and immediately absorbed against income taxed at the full applicable rate — and it’s a fair description of how the policy will actually behave for larger, more capital-intensive operations.</p>

<h2 id="the-same-three-farms-unincorporated">The same three farms, unincorporated</h2>

<p>Everything above assumes the farm is a corporation. A lot of Ontario farms aren’t — they operate as sole proprietorships or partnerships, reporting farm income directly on the operator’s personal return. That changes the math a lot, because personal income is taxed on a graduated ladder rather than the flat 12.2%/26.5% corporate split, and the top combined federal-Ontario rate for 2026 is <strong>53.53%</strong>, on taxable income above $258,482. Farms A and B below never get near that bracket; Farm C’s top slice does.</p>

<table>
  <thead>
    <tr>
      <th>Farm</th>
      <th>Regime</th>
      <th>CCA</th>
      <th>Taxable</th>
      <th>Tax</th>
      <th>Avg rate</th>
    </tr>
  </thead>
  <tbody>
    <tr>
      <td>A — $180,000 income, marginal rate 44.97%</td>
      <td>Old</td>
      <td>$6,000</td>
      <td>$174,000</td>
      <td>$54,627</td>
      <td>30.3%</td>
    </tr>
    <tr>
      <td> </td>
      <td>AII</td>
      <td>$18,000</td>
      <td>$162,000</td>
      <td>$49,231</td>
      <td>27.4%</td>
    </tr>
    <tr>
      <td> </td>
      <td>Mega</td>
      <td>$60,000</td>
      <td>$120,000</td>
      <td>$30,812</td>
      <td>17.1%</td>
    </tr>
    <tr>
      <td>B — $180,000 income, $480,000 combine</td>
      <td>Old</td>
      <td>$48,000</td>
      <td>$132,000</td>
      <td>$36,021</td>
      <td>20.0%</td>
    </tr>
    <tr>
      <td> </td>
      <td>AII</td>
      <td>$144,000</td>
      <td>$36,000</td>
      <td>$6,858</td>
      <td>3.8%</td>
    </tr>
    <tr>
      <td> </td>
      <td>Mega</td>
      <td>$480,000</td>
      <td>$0</td>
      <td>$0</td>
      <td>0% — <strong>$300,000 loss created</strong></td>
    </tr>
    <tr>
      <td>C — $650,000 income, top slice at 53.53%</td>
      <td>Old</td>
      <td>$48,000</td>
      <td>$602,000</td>
      <td>$279,639</td>
      <td>43.0%</td>
    </tr>
    <tr>
      <td> </td>
      <td>AII</td>
      <td>$144,000</td>
      <td>$506,000</td>
      <td>$228,250</td>
      <td>35.1%</td>
    </tr>
    <tr>
      <td> </td>
      <td>Mega</td>
      <td>$480,000</td>
      <td>$170,000</td>
      <td>$52,829</td>
      <td>8.1%</td>
    </tr>
  </tbody>
</table>

<p><em>(2026 combined federal + Ontario personal marginal rates, TaxTips.ca.)</em></p>

<p>Two things stand out. First, at identical pre-CCA income, every one of these farms pays substantially more tax unincorporated than incorporated — Farm A’s old-regime tax bill goes from $21,228 to $54,627 on the same $180,000, simply because none of it qualifies for the 12.2% small-business rate. Second, a deduction is worth whatever marginal rate it displaces, counting from the top of the income stack down. Farm C’s $480,000 write-off first knocks out income that would have been taxed at 53.53%, then 49.82%, then 48.26%, then 44.97% — which is why its average rate falls so much further than Farm A’s or B’s. Farm C is the only one of the three that ever touches the 53.53% bracket; for Farm A and B, that number is simply not relevant to their situation.</p>

<p>Running Farm A’s 8-year replacement cycle through the personal ladder instead of the flat corporate rate: the AII path totals $322,603 in nominal tax over 8 years (NPV $269,561); the Mega Deduction path totals $246,493 (NPV $202,814). The saving — <strong>$66,747</strong> — is <strong>more than three times</strong> the $18,691 saving in the incorporated version, for the exact same equipment spending. The dollars being moved earlier are the same; they’re just worth more per dollar at personal rates.</p>

<p>Farm B’s three strategies show something more interesting. Because the prior-year tax being carried back against is now personal tax on $180,000 (about $57,326/year, versus $21,960/year at the corporate small-business rate), the carryback ceiling is far higher — up to $171,977 versus $65,880:</p>

<table>
  <thead>
    <tr>
      <th>Strategy</th>
      <th>8-year NPV of tax paid</th>
    </tr>
  </thead>
  <tbody>
    <tr>
      <td>AII only</td>
      <td>$228,175</td>
    </tr>
    <tr>
      <td>Mega, loss carried forward only</td>
      <td>$225,394</td>
    </tr>
    <tr>
      <td>Mega, loss carried back 3 years</td>
      <td>$103,297</td>
    </tr>
  </tbody>
</table>

<p>The carryforward-only outcome barely beats AII here (about $2,800 better) — because a progressive personal ladder chews through a carried-forward loss against future income about as efficiently as AII’s own declining-balance schedule does. The carryback election is where the real difference is: <strong>$124,878</strong> better than AII, because that $171,977 refund comes back at personal marginal rates instead of the 12.2% corporate rate. For an unincorporated lumpy investor, actively filing the carryback isn’t a nice-to-have — it’s most of the benefit.</p>

<h2 id="farm-d-the-multi-income-case-where-the-ceiling-stops-mattering">Farm D: the multi-income case, where the ceiling stops mattering</h2>

<p>Everything so far assumes the farm loss — corporate or personal — is fully usable, whether against the same year’s income, a carryback, or a carryforward. That assumption breaks down for a specific group that makes up a real share of Ontario’s farmers: unincorporated farmers for whom farming is <em>not</em> their chief source of income — a spouse or operator with an off-farm job or business, running a smaller farm operation alongside it.</p>

<p>CRA’s restricted farm loss (RFL) rule applies whenever farming isn’t the taxpayer’s chief source of income, alone or combined with another source. It caps how much of a farm loss can be deducted against other income at <strong>$2,500 plus 50% of the next $30,000 — a hard maximum of $17,500 a year</strong>, once the loss exceeds $32,500. Anything beyond that becomes a restricted farm loss, which can be carried back 3 years or forward 20 — but only against <em>farming</em> income, never against the off-farm income that, by definition, is this taxpayer’s larger income source.</p>

<p>Take a farm with $40,000 of net farm income before CCA (a smaller, secondary operation) alongside $140,000 of off-farm income, buying the same $480,000 combine:</p>

<table>
  <thead>
    <tr>
      <th>Regime</th>
      <th>CCA</th>
      <th>Raw farm loss</th>
      <th>Deductible this year</th>
      <th>Restricted carryforward</th>
      <th>Tax this year</th>
    </tr>
  </thead>
  <tbody>
    <tr>
      <td>Old</td>
      <td>$48,000</td>
      <td>$8,000</td>
      <td>$5,250</td>
      <td>$2,750</td>
      <td>$37,215</td>
    </tr>
    <tr>
      <td>AII</td>
      <td>$144,000</td>
      <td>$104,000</td>
      <td><strong>$17,500</strong></td>
      <td>$86,500</td>
      <td>$31,897</td>
    </tr>
    <tr>
      <td>Mega</td>
      <td>$480,000</td>
      <td>$440,000</td>
      <td><strong>$17,500</strong></td>
      <td>$422,500</td>
      <td>$31,897</td>
    </tr>
  </tbody>
</table>

<p>Once the raw loss clears $32,500 — which both AII’s 30% claim and the Mega Deduction’s 100% claim do easily on a $480,000 purchase — the deductible amount is capped at the same $17,500 either way. <strong>AII and the Mega Deduction produce an identical tax bill this year.</strong> The only thing the extra 70 percentage points of “immediate expensing” buys is a much bigger restricted carryforward ($422,500 versus $86,500) that can only ever be used against this farm’s own future farming income — at roughly $40,000/year of farm income and no further purchases, that’s about 2.2 years to exhaust under AII versus 10.6 years under the Mega Deduction, well inside the 20-year limit either way, but tied up for a decade rather than freed up for anything else. For this group, the ceiling the government raised from 30% to 100% was, in year one, entirely beside the point.</p>

<h2 id="incorporation-is-doing-more-work-here-than-the-deduction-is">Incorporation is doing more work here than the deduction is</h2>

<p>Put the last two sections together and a pattern shows up that has nothing to do with the Mega Deduction specifically: <strong>how a farm is structured changes the value of this policy more than the policy’s own headline rate does.</strong> An incorporated farm operating as its own CCPC gets the flat 12.2%/26.5% rates, ordinary non-capital-loss treatment (full carryback/carryforward against any income, no chief-source test), and — because a standalone farm corporation’s chief source of income is, definitionally, farming — the restricted farm loss rule generally doesn’t apply to it at all. An unincorporated multi-income farm household gets none of those things by default: higher marginal rates (which cuts both ways — bigger tax bills, but also bigger deductions), no shelter from the RFL test, and a hard $17,500 annual ceiling on using a large loss against the household’s biggest income source.</p>

<p>None of this is a reason to incorporate on its own — there are real costs and other trade-offs to running a farm as a corporation, well beyond the scope of this piece. But for a multi-income household weighing a large equipment purchase against Farm D’s restricted-loss math, it’s worth knowing that the entity-structure question is doing at least as much work as the AII-versus-Mega-Deduction question the government’s announcement is actually about.</p>

<h2 id="so-is-the-governments-claim-misleading">So is the government’s claim misleading?</h2>

<p>Not false — but it describes the upper end of a range, not the typical case. The -6.0% agriculture METR is a real, defensible number for the specific scenario it models: a marginal investment large enough to matter but small enough (or the farm’s income large enough) that the deduction is used dollar-for-dollar the same year it’s claimed. That’s Farm C, incorporated or not. It’s not automatically true of Farm B, which is arguably the more common shape for a mid-size Ontario grain or livestock operation — infrequent, large capital purchases against income that doesn’t scale with the purchase. For Farm B, the practical outcome ranges from “modestly better than AII” to “dramatically better than AII,” and which end it lands on depends on a tax-planning decision (the carryback election), a balance-sheet fact (three years of prior taxable income), and, as shown above, whether the farm is incorporated at all — none of which have anything to do with the size of the equipment purchase itself. And it’s not true at all for Farm D’s shape — a multi-income household where farming is a secondary source of income — where the restricted farm loss rule can make the 100%-vs-30% distinction irrelevant in the year of purchase, full stop.</p>

<p>It’s also worth separating two different questions the policy debate tends to blur together: whether the Mega Deduction changes <em>how much</em> tax a farm pays over the life of an asset (mostly no — CCA is a timing mechanism, and a dollar spent on equipment was always going to be fully deductible eventually, AII or not) versus whether it changes <em>when</em> that tax relief arrives (yes, and for some farms, substantially). The “negative tax rate” framing is a when-question dressed up as a how-much-question.</p>

<h2 id="what-this-means-for-the-next-equipment-purchase">What this means for the next equipment purchase</h2>

<ul>
  <li><strong>Check the September 15, 2026 line.</strong> Equipment bought earlier in 2026 falls under the AII’s 30% first-year ceiling, not the 100% Mega Deduction — the purchase date matters for anything acquired this year specifically.</li>
  <li><strong>Not everything qualifies for 100%.</strong> The general exclusions include Class 10/10.1 vehicles (most trucks and passenger vehicles) — a farm’s next half-ton or grain truck may still be capped at AII treatment, not full expensing, even as the tractor or combine purchased alongside it gets 100%.</li>
  <li><strong>CCA claims are elective — you’re never forced to overclaim.</strong> If a large purchase would push you into an unusable loss, you can simply claim less than the maximum and carry the remaining undepreciated capital cost forward at 100% future flexibility, rather than automatically defaulting to a non-capital-loss carryforward or carryback.</li>
  <li><strong>The carryback election is where the real money is, for lumpy purchases.</strong> If a large purchase creates a loss, actively evaluate the 3-year carryback against simply letting it carry forward — the difference was worth $60,000-$125,000 in present value in the Farm B scenarios above (corporate and personal respectively), and it isn’t automatic.</li>
  <li><strong>Steady replacers benefit too, just more quietly.</strong> There’s no loss-management decision to make, but the acceleration is still worth real money over time — it just shows up as a lower run-rate tax bill for years, not a single dramatic write-off.</li>
  <li><strong>Know whether farming is your “chief source of income.”</strong> If it isn’t — a common situation for multi-income farm households — the restricted farm loss rule can cap what a large purchase actually does for you at $17,500 a year against your other income, regardless of whether the deduction itself is 30% or 100%. That’s a conversation to have with a tax professional before, not after, a major purchase.</li>
  <li><strong>Entity structure changes the payoff more than the deduction does.</strong> The same purchase is worth a very different amount depending on whether the farm is incorporated — both because of the tax rate itself and because a farm corporation generally isn’t subject to the restricted farm loss test the way an unincorporated multi-income household is.</li>
</ul>

<h2 id="what-to-watch">What to watch</h2>

<ul>
  <li>Whether Finance Canada or the PBO publishes farm-specific (rather than whole-of-agriculture) METR or uptake estimates, which would show how much of the claimed benefit concentrates in larger operations</li>
  <li>Any additional guidance from CRA on which farm asset classes (particularly grain trucks and mixed-use vehicles) fall inside versus outside the Mega Deduction’s exclusion list</li>
  <li>Uptake of the 3-year loss carryback election on 2026 farm corporate tax filings, once that data becomes available</li>
  <li>Whether the 2030 phase-down schedule for AII-eligible property (for anything that doesn’t qualify for the permanent Mega Deduction) changes before it takes effect</li>
  <li>Whether Finance Canada revisits the restricted farm loss thresholds ($2,500 / $30,000 / $17,500 have been unchanged for decades and aren’t indexed) now that a much larger deduction is available for the losses they’re capping</li>
</ul>

<hr />

<p><em>This analysis is for informational purposes only and does not constitute tax or investment advice. Figures are illustrative scenarios built from public CCA rules and stated Ontario corporate and personal tax rates, not a specific farm’s actual financial position — consult a tax professional before making equipment-purchase, loss-election, or entity-structure decisions. See our <a href="/smirnoc-capital/disclaimer/">disclaimer</a> for details.</em></p>]]></content><author><name></name></author><category term="tax-policy" /><category term="farm-economics" /><category term="capital-investment" /><summary type="html"><![CDATA[The new Productivity Mega Deduction gives 100% immediate expensing on farm equipment, and Finance Canada pegs agriculture's marginal effective tax rate at -6.0%. Whether a given farm sees that in cash depends on purchase size relative to income, whether the farm is incorporated, and — for a lot of Ontario's multi-income farmers — a little-discussed rule called the restricted farm loss that can cap the whole thing at $17,500 a year regardless of how much is spent.]]></summary></entry><entry><title type="html">Can the US Actually Get Meaningful Potash Out of Belarus?</title><link href="https://smirnoccapital.github.io/smirnoc-capital/trade-policy/fertilizer/tariffs/2026/09/21/us-belarus-potash-feasibility.html" rel="alternate" type="text/html" title="Can the US Actually Get Meaningful Potash Out of Belarus?" /><published>2026-09-21T00:00:00+00:00</published><updated>2026-09-21T00:00:00+00:00</updated><id>https://smirnoccapital.github.io/smirnoc-capital/trade-policy/fertilizer/tariffs/2026/09/21/us-belarus-potash-feasibility</id><content type="html" xml:base="https://smirnoccapital.github.io/smirnoc-capital/trade-policy/fertilizer/tariffs/2026/09/21/us-belarus-potash-feasibility.html"><![CDATA[<p><strong>By Kal Sharven</strong></p>

<p><strong>TL;DR:</strong> President Trump says the US is working on a “massive” potash deal with Belarus, priced well below what Washington currently pays Canada. Belarus does have the reserves and, increasingly, the production capacity to supply more. What it doesn’t have is an efficient way to get that potash to the US — its main export corridor into the Baltic was cut off by EU sanctions in 2022, and everything since has moved through Russian rail and ports that Belarus doesn’t control and must share with Russia’s own, much larger potash exporter. History backs up the skepticism: even when Belarus had full access to the efficient route, the US bought a fraction of what it buys from Canada.</p>

<h2 id="background">Background</h2>

<p>On December 17, 2025, the US Treasury’s Office of Foreign Assets Control lifted sanctions on Belaruskali (Belarus’s state potash producer) and its export arm, part of a deal in which Belarus released more than 120 political prisoners. On September 21, 2026, Trump said a purchase deal with Belarus is “in the works,” framing it as leverage in an escalating trade dispute with Canada, which supplies roughly 85% of the potash the US imports.</p>

<p>Belarus is not a marginal player: it holds an estimated 21% of global potash reserves, second only to Canada, and supplied around 20% of the global export market before Western sanctions hit in 2021. That’s the case for why this deal is being talked about at all. The question is whether Belarus can actually move meaningfully more potash to the US, and at what cost.</p>

<h2 id="is-there-enough-production-and-export-capacity">Is there enough production and export capacity?</h2>

<p>Production doesn’t look like the constraint. FAOSTAT data show Belarusian potash (MOP) production holding around 10–12 million tonnes a year through 2020, and Belaruskali’s Nezhinsky project is set to add another 2 million tonnes/year of capacity when it comes online in Q2 2026.</p>

<p>Exports are a different story. FAOSTAT export figures show Belarusian MOP exports falling off a cliff after 2021 — from roughly 11.2 million tonnes in 2021 to 4.2 million (2022), 4.9 million (2023), and 3.6 million tonnes (2024). Production didn’t fall nearly that much; the export chain did. That gap is the whole story: Belarus can mine the potash, it just can’t move it out the way it used to.</p>

<p>The reason is Lithuania, and it’s worth being precise about the mechanism, since it’s the crux of why one route is closed and another isn’t. In June 2021, the EU imposed sectoral sanctions on Belarus — a response to the forced diversion of Ryanair Flight 4978 to arrest a dissident journalist — banning EU entities from importing or trading most grades of Belarusian potash. That alone is an import ban, not necessarily a transit ban: goods merely passing through EU territory to a non-EU buyer aren’t automatically caught by it. Lithuania went further on its own initiative: on February 1, 2022, Lithuanian Railways cancelled its 2018 transit contract with Belaruskali outright, after a government commission ruled the agreement conflicted with national security interests. That specific, additional step is what shut Klaipėda — the port that had handled 9–11 million tonnes of Belarusian MOP a year, over 90% of total exports — to Belarusian potash. EU tariffs on what Belarusian potash can still reach EU buyers by other means are also set to escalate further (roughly €40–45/tonne now, rising to €60 this summer, €80 in 2027, and €350 by 2028), pushing Belarus to look even harder for non-EU buyers.</p>

<h2 id="what-export-path-is-actually-available">What export path is actually available?</h2>

<p>Since 2022, Belaruskali has rerouted through Russia: rail to Russian-controlled Baltic terminals — mainly Ust-Luga and St. Petersburg, with Belarus also eyeing its own terminal at nearby Bronka — and in some cases much further afield to Novorossiysk (Black Sea), Astrakhan (Caspian), Murmansk (Arctic), or even Vladivostok (Pacific), with rail hauls ranging from roughly 400 km up to several thousand km depending on the port used, versus the more direct Klaipėda route.</p>

<p>That route is “open” only in the narrow sense that neither the EU import ban nor Lithuania’s transit ban has any jurisdiction on Russian soil — Russia isn’t an EU member and isn’t enforcing EU sanctions against its ally Belarus. It isn’t friction-free: Russia itself has been under a broad, separate Western sanctions regime since its 2022 invasion of Ukraine, which can complicate the insurance, financing, and vessel chartering needed for the ocean leg out of a Russian port, on top of the infrastructure-sharing problems below.</p>

<p>Two problems with this path specifically for a US deal:</p>

<ol>
  <li><strong>Belarus doesn’t control it.</strong> These are Russian ports and Russian railways, already loaded with Russia’s own potash exporter, Uralkali — the world’s second-largest — which takes precedence. Belarusian industry watchers have flagged disputes over both terminal/rail access and pricing.</li>
  <li><strong>It doesn’t get product to the US on its own.</strong> A Russian Baltic port is still an ocean crossing away from any US buyer. Getting Belarusian potash to the US farm belt would mean rail through Russia, transatlantic ocean freight to a US Gulf or East Coast terminal, then further inland transport to reach the Midwest — three additional handling legs that Canadian potash skips entirely.</li>
</ol>

<p>For comparison, Canadian potash for the US market moves by direct unit train from Saskatchewan mines straight into the US Midwest — no ocean leg, no port transload, one rail jurisdiction. That single-mode route is a large part of why Canada supplies roughly 11–12 million tonnes a year to the US at a current benchmark price of $305–310/short ton FOB NOLA, “already the most affordable nutrient domestically” per fertilizer-market reporting.</p>

<div style="margin: 1.5em 0;">
  <iframe src="/smirnoc-capital/assets/maps/potash-routes.html" style="width: 100%; height: 560px; border: 1px solid #ccc; border-radius: 6px;" loading="lazy" title="Potash routes: Belarus vs. Canada to the US"></iframe>
  <p style="font-size: 0.85em; margin-top: 0.4em;">
    <a href="/smirnoc-capital/assets/maps/potash-routes.html" target="_blank" rel="noopener">Open the map fullscreen &rarr;</a>
    Same destination market, three paths: Canada's direct rail route, Belarus's current (longer) route through Russia, and the Klaipėda route Belarus can no longer use.
  </p>
</div>

<p>We don’t have a precise, route-specific freight quote for the Belarus-to-US path — that’s not publicly published — but the closest available benchmark, US Gulf–Europe Panamax dry-bulk freight, ran around $23/tonne in April 2026, which gives a rough sense of the size of just the ocean-freight leg alone, before rail and port handling on both ends are even added in. The more telling evidence is that Belaruskali has reportedly had to discount 50–60% below market price to move volume through this route since 2022 — even at a steep discount, the logistics chain is eating heavily into what the seller nets back.</p>

<h2 id="so-how-massive-could-this-realistically-be">So how “massive” could this realistically be?</h2>

<p>There’s a useful precedent: from 2017–2021, when Belarus still had full access to the efficient Klaipėda route, the US imported an average of just 635,000 tonnes of Belarusian MOP a year — about 5% of the roughly 11–12 million tonnes the US now buys annually from Canada. That’s the ceiling Belarus hit with the <em>easy</em> route open.</p>

<p>There’s also a demand-side complication: most of Belarus’s shrunken exportable supply is already spoken for. China’s share of Belarusian potash sales rose from 17% in 2021 to over 70% by 2023, as Belarus redirected volume away from markets it lost (its Africa export share collapsed from 42% to 3%; India “almost completely ceased” buying). Any meaningful new allocation to the US would have to come from genuinely new production (the 2 million tonnes/year from Nezhinsky is the closest thing on the horizon) or a reallocation away from China — neither happens instantly, and neither is guaranteed by an OFAC sanctions release alone, which doesn’t by itself restore the correspondent banking, insurance, and customs relationships needed to actually trade at scale.</p>

<p>None of this means zero Belarusian potash reaches the US. It means “massive” and “substantially cheaper than Canada” are doing a lot of work in the current rhetoric, and the underlying logistics don’t obviously support either claim yet.</p>

<h2 id="what-to-watch">What to watch</h2>

<ul>
  <li>Whether the Nezhinsky project’s 2 million tonnes/year actually comes online in Q2 2026 as scheduled, and who it gets sold to</li>
  <li>Any concrete tonnage, pricing, or shipping-route details once a deal is actually signed, versus the current statement of intent</li>
  <li>Whether EU tariff escalation pushes more Belarusian volume toward non-EU buyers generally, and whether any of that specifically lands in the US</li>
  <li>The parallel US-Canada trade fight: threatened tariffs on Canadian fertilizer would change the relative economics regardless of what Belarus can physically deliver</li>
</ul>

<hr />

<p><em>This analysis is for informational purposes only and does not constitute investment advice. See our <a href="/smirnoc-capital/disclaimer/">disclaimer</a> for details.</em></p>]]></content><author><name></name></author><category term="trade-policy" /><category term="fertilizer" /><category term="tariffs" /><summary type="html"><![CDATA[Trump says a 'massive' Belarus potash deal is coming, pitched as leverage against Canada. The export route Belarus would have to use tells a more modest story.]]></summary></entry></feed>